
Can Our EA Pass Prop Firm Challenges? We Simulated the Odds!
## What's the Big Idea?
A beginner-friendly summary of the verification: “Can Our EA Pass Prop Firm Challenges? We Simulated the Odds!”.
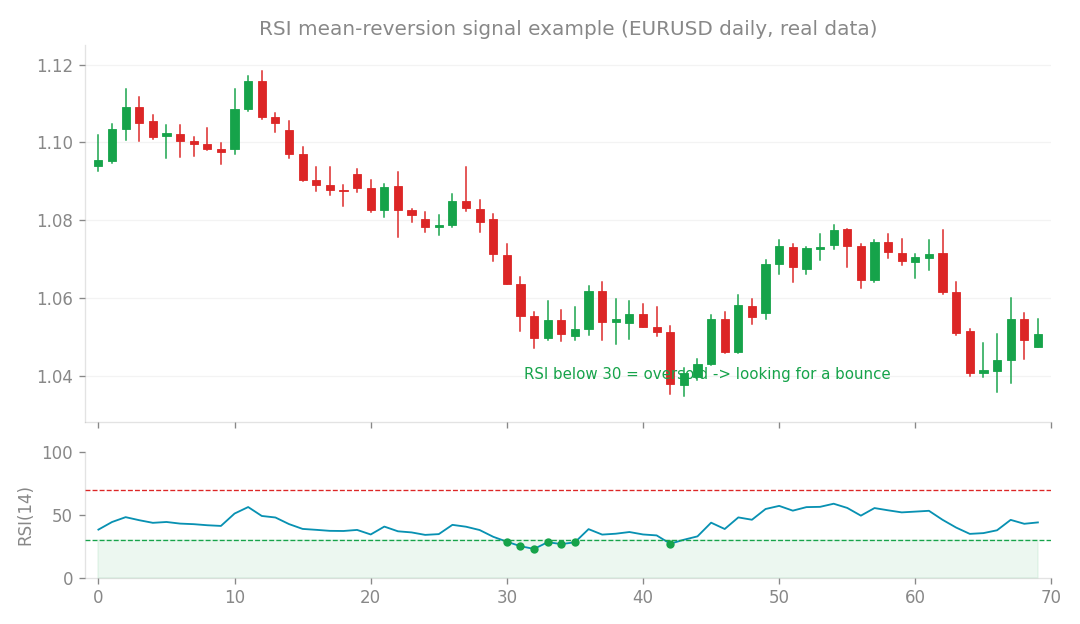
Mean-reversion (RSI) signal example (EURUSD daily, real data): look for a bounce when RSI is oversold.
What’s the Big Idea?
Ever wondered if your algorithmic trading strategy (EA) has what it takes to pass a prop firm challenge? That’s exactly what we set out to explore with our latest research! We wanted to figure out the probability of success for a given strategy, not just in theory, but by simulating the actual rules of a prop firm. Imagine you have a trading strategy, and you’ve seen how it performs day-to-day. We take that history of daily returns and essentially shuffle and re-deal it many, many times. This process is called block bootstrap resampling – it helps us create thousands of potential future scenarios based on your strategy’s past performance, but with enough randomness to feel realistic. Then, for each of these simulated futures, we apply the prop firm’s specific rules to see how often our strategy would “pass” the challenge.
How We Put It to the Test
For this specific experiment, we focused on a well-known prop firm, Fintokei. While they advertise “unlimited” trading days for their challenge, we set a practical upper limit of 750 days for our simulations. Why? Because even “unlimited” has practical bounds, and we needed a cutoff for our tests to keep things manageable. The challenge rules we simulated were quite typical: achieve an 8% profit target to pass, but don’t hit a -10% maximum loss, or you’re disqualified. Interestingly, this asymmetry – a smaller profit target (+8%) compared to the maximum allowable loss (-10%) – actually favors a first-time pass. It gives you a bit more breathing room on the upside relative to the downside.
The Strategy We Used
Our “guinea pig” strategy for this simulation was a D1 RSI Mean Reversion strategy on JPY currency pairs. If you’re new to this, a Mean Reversion strategy tries to profit when prices move too far from their historical average, expecting them to “revert” back. The D1 RSI part means it looks at daily charts using the Relative Strength Index (RSI) indicator to spot these potential reversals. For our tests, we set the risk per trade at approximately 1% of the account.
So, What Happened?! (The Results Are In!)
After running countless simulations, the results were quite fascinating! With our D1 RSI Mean Reversion strategy risking about 1% per trade, we found an overall pass probability of approximately 38%. In other words, if you were to attempt this challenge repeatedly with this strategy, you’d expect to pass about 38 out of every 100 attempts. This translates to an expected 2.6 attempts to finally pass the challenge. And if each attempt has an entry fee, we estimated the total cost to pass would be around ¥33,000 (roughly $220 USD). We also discovered a crucial point: sizing matters! There’s an optimal sweet spot for how much you risk or how big your trades are. If your sizing is too small, you might never reach the 8% profit target within the simulated 750 days (even if it’s “unlimited,” practically, time runs out). But if your sizing is too large, you’re much more likely to hit that -10% maximum loss and get disqualified. It’s like finding the perfect gear for climbing a hill – too low, and you’re slow; too high, and you might stall! Perhaps the most encouraging finding was that even a “microscopic edge” – meaning a strategy that’s only slightly better than random – still significantly outperformed a “zero-edge” scenario. A completely random strategy, with no true edge at all, had a pass probability of only 20.7%. Our strategy, even with its subtle edge, clearly did much better than that!
Important Caveats (Don’t Get Too Excited Just Yet!)
Now, before you start throwing money at prop firm challenges, a few important warnings. Firstly, our simulations were on the optimistic side. We didn’t factor in things like potential intraday losses that might trigger a daily drawdown rule (if the prop firm has one). We also assumed that the strategy’s past performance (its historical daily return distribution) would perfectly predict its future performance, which isn’t always the case in the real world. The market is constantly evolving! Secondly, and this is a big one: passing the challenge is not the same as continuously withdrawing profits from a funded account. Passing just gets you in the door. To keep withdrawing profits, your strategy needs a true, robust edge in the market. That’s a whole different ball game, and something we’re always working to verify. Think of it like getting a driver’s license versus actually being a safe, skilled driver for years.
What’s Next on Our Journey?
Our next step is to expand this model even further. We want to calculate the Expected Value (EV) of the entire process. This means not just the probability of passing, but also the expected returns from the “post-funding phase” – how much profit you’d expect to withdraw after passing, before eventually hitting a rough patch or failing the funded account rules. By combining this with the entry fees, we can get a complete picture of the overall Expected Value of participating in these challenges. Stay tuned for more insights!