My prop challenge math said +¥71,227, then a zero-edge test and one -6.32% day broke it
Three early studies that turned a prop-firm challenge from a gamble into arithmetic: a Monte Carlo pass-rate estimate, a fee-inclusive expected value model, and a minute-by-minute rebuild of account equity. How a 38% pass rate and +¥71,227 of expected value collapsed under a zero-edge sanity check and one currency-intervention day.
A 38% pass rate and +¥71,227 of expected value. That is what my first prop-challenge simulation handed me, and for a moment it looked like a green light. Then a sanity check showed the same model paying +¥45,753 to a strategy with zero edge, which is impossible, and a minute-by-minute rebuild of the account found one intervention day where equity sank 6.32% intraday. Instant disqualification, on a day my daily-bar backtest recorded as spotless.
This article merges three early studies from my research log (studies 10, 11 and 12) into one story: how I stopped treating a prop challenge as a lottery ticket and built the yardsticks that measure it, one honest number at a time. There is no winning system in this post. What there is, is a map of exactly where optimistic math lies to you.
First time here? What you need to know
For new readers: this blog is a verification diary. I (one person) build my own automated FX trading program (an EA), statistically test trading methods, and publish everything, wins and losses alike. “Study N” refers to my numbered research log; this post covers numbers 10 through 12, from the foundation-laying days.
Two prerequisites. A prop firm funds traders who pass an evaluation (a “challenge”) and shares the profits with them. The firm in question here is Fintokei: reach a +8% profit target and you pass, touch a -10% maximum loss and you fail, and every attempt costs an entry fee. You get to trade big capital without risking your own savings, but since prop firms run profitably, most challengers must be losing.
The second is Monte Carlo simulation (MC). Take a strategy’s daily returns, resample them into thousands of alternative orderings, and replay thousands of possible account fates. A single backtest can be luck; thousands of replays let you judge the whole range of luck. When this blog says “MC pass rate”, it means the probability of passing a prop firm’s rules estimated this way.
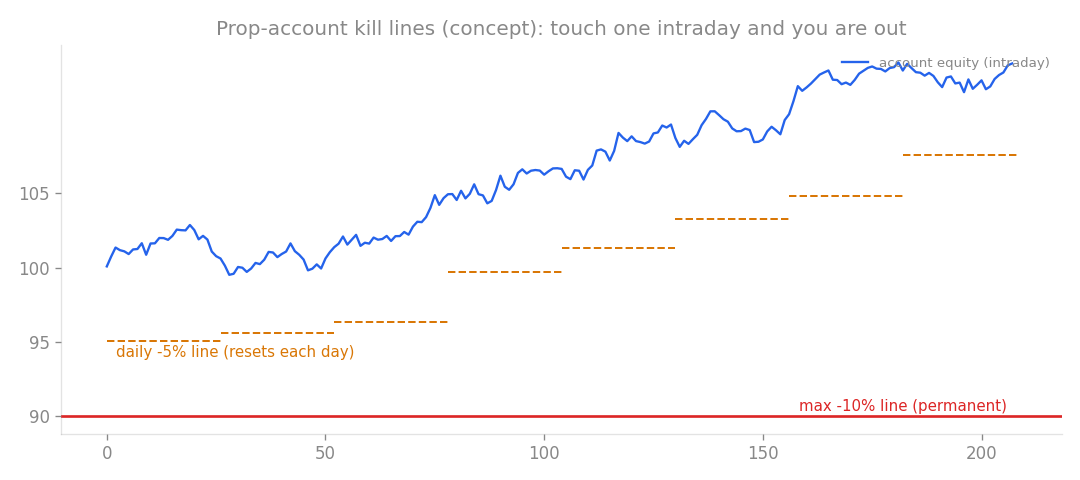
Prop-account kill lines (concept). Reach the target first and you pass; touch the loss line even for a moment and you are out. That “even for a moment” becomes the villain of this story.
Your pass rate is a number you can estimate (study 10)
The first question was naive on purpose: if I entered the challenge with my current strategy, what are the odds I pass?
The raw material was the daily returns of a daily-bar RSI mean-reversion strategy on JPY pairs (mean reversion means buying an oversold dip and selling the bounce). I resampled those returns with block bootstrapping, which shuffles multi-day chunks rather than single days so that streaky market behavior survives the shuffle, then applied Fintokei’s rules to each simulated path. Fintokei sets no limit on trading days, so I capped each evaluation at 750 days.
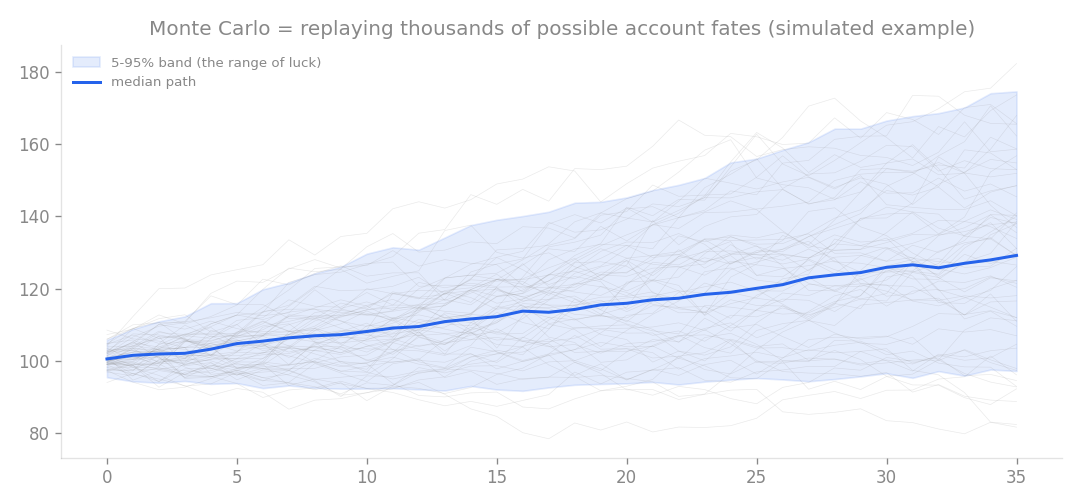
How Monte Carlo works (simulated example). The same strategy fans out into very different account paths depending on luck alone.
| Metric | Result |
|---|---|
| Risk per trade | ~1% |
| Pass rate | ~38% |
| Expected attempts to pass | 2.6 |
| Expected entry fees until passing | ~¥33,000 |
Roughly a 4-in-10 chance per attempt. Since a failed attempt only costs the entry fee, the expectation works out to passing around the 2.6th try, about ¥33,000 in fees.
The surprise was position sizing. Size too small and the account cannot reach +8% within the window; size too large and equity volatility keeps clipping the -10% line. There is a sweet spot in the middle that maximizes the pass rate. The intuition that smaller risk is always safer simply fails in a game with a target and a clock.
The control experiment mattered too. A zero-edge strategy, pure coin flipping, passes the same rules 20.7% of the time, because the +8% target versus -10% limit is an asymmetry that favors the challenger. Read one way, that is sobering: one in five random traders passes. Read the other way, my 38% clearly beats the zero-edge baseline, which is evidence of a small but real edge.
I wrote two warnings to myself in the same note. This number ignores intraday moves entirely, so it sits on the optimistic side. And passing a challenge is a different problem from withdrawing profits month after month once funded. Which led straight to the next question: fees in, withdrawals out, what is the whole pipeline worth?
A model that pays a zero-edge trader is a broken model (study 11)
Study 11 modeled Fintokei’s Quartz plan, a ¥1,000,000 account with a ¥12,500 entry fee at 1% risk, end to end: challenge, funding, withdrawals, and eventual disqualification.
| Metric | Result |
|---|---|
| Total expected value (EV) | +¥71,227 |
| Pass rate | 38% |
| Expected withdrawal after funding | 9.3% |
| System lifespan | 311 days |
Positive expected value even after fees. Tempting. Before acting on it, I ran a sensitivity analysis, which means wiggling the model’s assumptions to see how much the conclusion moves. That is where the alarm went off.
Setting the strategy’s edge to exactly zero still produced an EV of +¥45,753.
That cannot be right. Prop firms are built to make money for the house, so a trader with no edge must have negative expected value, the same way a casino patron does. A model that pays a zero-edge trader ¥45,753 is not revealing a loophole; it is confessing that its own assumptions are more generous than reality.
The root cause turned out to be structural. A Monte Carlo built on daily returns never sees what happens inside a day. A day that closes at -5% may have been much deeper at its worst moment, and prop rules trigger on that worst moment, not on the close. Underestimate those breaches and everything downstream inflates: pass rate, lifespan, withdrawals. When I demeaned the returns so the after-cost average was zero, the realistic version of the calculation lost money.
So the conclusion of study 11 was to distrust its own headline number. With an edge this weak, the real-world EV is likely negative. Any challenge attempt should be sized as a calculated risk where the worst case is losing the entry fee, nothing more. And before trusting any EV again, I needed a risk model that actually sees inside the day.
The 0.00% worst day that was actually -6.32% (study 12)
On daily bars, this strategy’s record showed a worst single-day loss of 0.00%. Untouched. A daily bar is one data point per day, so anything that happens between open and close, however violent, leaves no trace as long as the close recovers. A prop account does not enjoy that amnesia: touch the line intraday and you are gone.
Study 12 rebuilt account equity minute by minute, expanding unrealized profit and loss on 1-minute (M1) bars for every period the strategy held a position, then checked the prop rules against that minute-level curve. This ran on out-of-sample data (OOS), the untouched portion of history reserved for answer-checking.
| Evaluation | Worst daily loss | Verdict |
|---|---|---|
| Daily bars only | 0.00% | Clean |
| M1 intraday rebuild | -6.32% (April 29, 2024) | Disqualified |
April 29, 2024 was a USD/JPY currency-intervention day. The RSI contrarian position was leaning against the intervention-driven move and took the hit head on, sinking 6.32% intraday. By the close, the daily bar had smoothed the whole episode away.
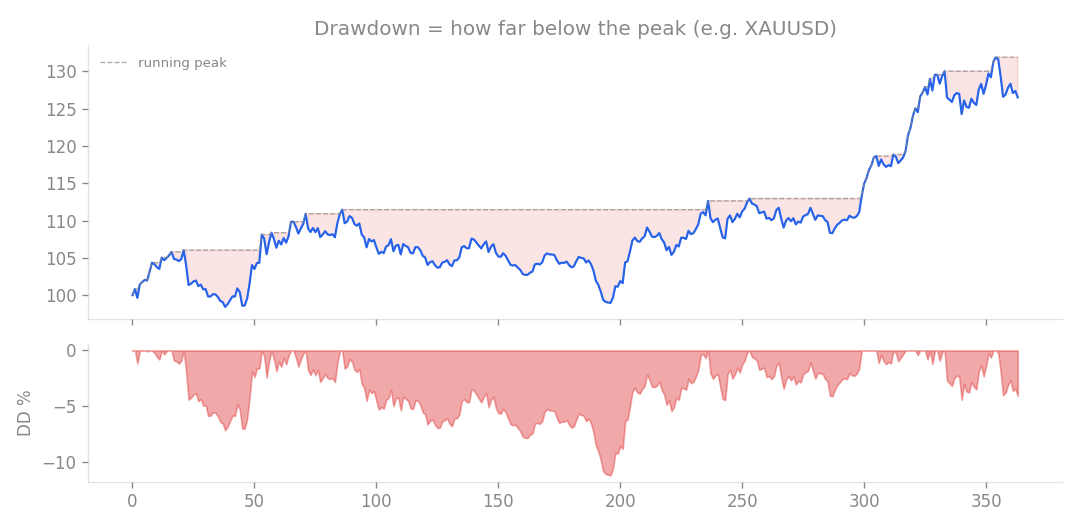
Drawdown, the fall from an equity peak. Daily bars measure the valley from daily points; the intraday valley can be deeper, and prop rules live in the intraday one.
This settled how to read the earlier studies. The 38% pass rate and the +¥70,000 EV both counted, as clean, a stretch of history in which the account would have been disqualified on the spot. Study 11’s sensitivity check had said “something in here is too generous”; study 12 found the something. From this point on, every strategy on this blog is judged against the minute-level rebuild, not the daily bars.
What the three yardsticks bought
Three studies, one toolbox:
- A pass rate can be estimated, but daily-return simulations lean optimistic
- An EV model can be diagnosed by feeding it a zero-edge strategy and seeing if it still pays
- Intraday risk only becomes visible when equity is rebuilt from 1-minute bars
At this point in the log, the strategy itself did not have an edge robust enough to keep withdrawing from a funded account, and I said so in the notes. The value was the machinery: a rig that rejects unusable strategies before real money touches them. Capital preservation came before capital growth, in the most literal way.
If you take anything from this post, take the three habits. Never commit to a prop challenge on daily-bar backtest results alone. When someone shows you a positive-EV model for a challenge, ask what it pays a zero-edge trader; if the answer is positive, the model is broken, not the casino. And if you enter anyway, size the decision so the downside is the entry fee and nothing else. None of that is glamorous, and all of it came out of the measurements above.
This article is a merged write-up of studies 10, 11 and 12.