Why a 0.85% monthly backtest becomes 0.7% in a live account, measured cost by cost
Four studies on the trading costs that sit between a backtest and a live account: spread, slippage, swap and gap fills. The monthly return barely bends, but the drawdown deepens, an aggressive blend sees its drawdown double, and the last unknown left standing is the real swap rate.
A system that backtests at 0.85% per month earns about 0.7% in a live account. That is my measured answer, and the interesting part is where the missing piece goes. The monthly return itself barely bends. What deepens is the drawdown, by an extra 1.5 to 2 percentage points, because costs attack the risk side of the ledger before they touch the profit side.
This article merges four cost studies (research notes 106, 107, 109 and 203) into one story: the campaign to measure everything that sits between a backtest curve and a real brokerage account. Spread, slippage, swap, and the way prices jump over stop orders.
First time here? What you need to know
For new readers: this blog is a verification diary. I (one person) build my own automated FX trading program (an EA), statistically test trading methods, and publish everything, wins and losses alike. “Study N” refers to my numbered research log. The tests run on about 11 years of real data across FX pairs, gold and stock indices.
A few terms. PF (profit factor) = gross profit over gross loss, above 1 means profitable. DD (drawdown) = the peak-to-trough decline in account equity. MC (Monte Carlo pass rate) = the probability of passing prop-firm rules, estimated by resampling daily returns. Slippage = the gap between the price you ordered and the price you actually got. Swap = the interest-rate charge or credit applied to positions held overnight.
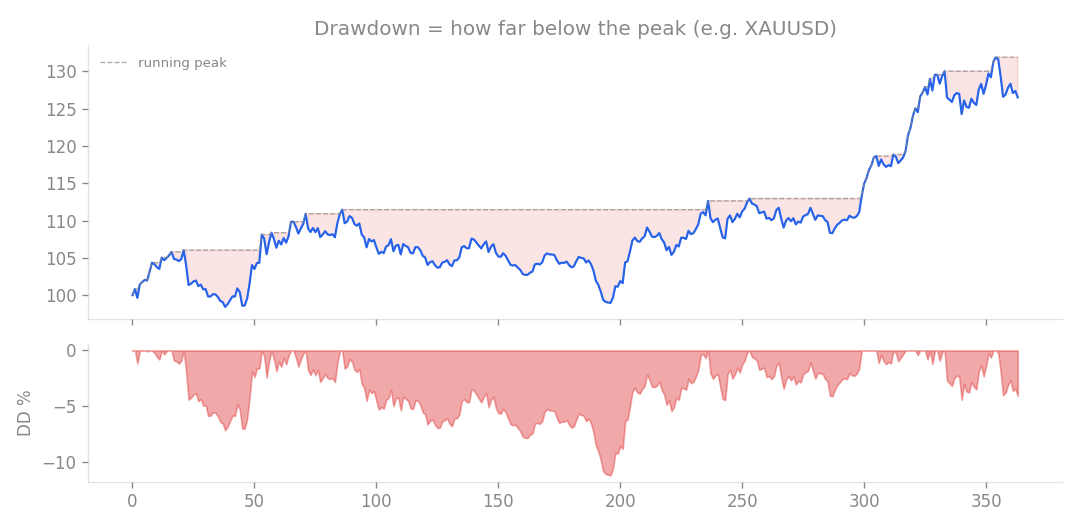
Drawdown is the protagonist of this article. Costs come for the depth of this valley before they come for the returns.
Study 106: does the system survive extra costs at all?
The subject was my core system of the time (Core v1.4.0), a portfolio of trading logics with an average holding period of 6.8 days and 6,168 trades over 11 years. A deliberately low-frequency design. The first experiment simply piled extra cost on top of the backtest.
| Condition | Monthly return | DD | MC pass rate |
|---|---|---|---|
| Zero cost | 0.85% | -9.7% | 94% |
| +2 pips per trade | 0.79% | -12.0% | 91% |
The return held up surprisingly well, easing from 0.85% to 0.79%. The drawdown did not. It swelled from -9.7% to -12%, and the culprit is slippage on stop-loss orders. When a stop fills at a worse price than planned, only the losing trades get bigger, so the valley deepens while the average profit barely moves.
Rerunning with realistic costs (1 pip of slippage plus a $7 per lot commission) showed that at a risk setting of 0.003 (0.3% of capital per trade) the drawdown reaches -11.5%, past my 10% comfort line. So the live configuration dropped one notch to 0.0025 (0.25%), which keeps the cost-inclusive drawdown near 10% and targets roughly 0.7% per month.
Put differently, live expectations land at about 88 to 95% of the backtested return. That squares with a separate research track of mine, where FX retains about 83% of theoretical performance after costs and gold only about 45%.
Study 107: is swap a friend or an enemy?
Next came the overnight financing. With positions held 6.8 days on average, the nightly interest-rate charge is not a rounding error. I computed it as trade notional times holding days times each asset’s daily swap rate. The notional-day exposure concentrates in JPY crosses at 4,213, followed by indices at 1,082, gold at 895 and non-JPY pairs at 229.
| Scenario | Monthly impact |
|---|---|
| Current regime (USD rates above JPY, tailwind) | +0.18% |
| Neutral (no rate differential) | -0.04% |
| Yen-carry reversal (headwind) | -0.30% |
Right now, swap is a friend. The positive carry collected on long JPY-cross positions more than offsets the financing cost of holding gold and indices. The one scenario to watch is a yen-carry unwind, which flips the whole thing into a 0.30% monthly drag.
Combining this with study 106 gave the full pre-launch picture: spread and slippage cost about 0.04% per month and add 1.5 to 2 points of drawdown, swap ranges from neutral to +0.18%, and the live account at risk 0.0025 should deliver roughly 0.7 to 0.8% per month at around 10% drawdown.
Study 109: the aggressive blend is fragile, and holding period is why
So far, the defensive core. I also had an aggressive configuration waiting: the core plus a set of per-pair strategies intended to harvest extra return in favorable regimes. Measured under the same realistic costs, it turned out far more fragile than the core.
The reason is holding period. The core holds for 6.8 days. The per-pair strategies hold for 1.2 to 1.3 days (Donchian and ATR logics), and the FX Connors components on EURJPY and GBPNZD close after just 0.2 days. The shorter the hold, the thinner the profit per trade, and the same spread and commission take a proportionally bigger bite.
| Metric | Before costs | After realistic costs |
|---|---|---|
| Current-regime monthly return | 2.43% | 1.86% |
| Full-history monthly return | 1.38% | 0.91% |
| Full-history DD | -14% | -28% |
| Full-history MC pass rate | 89% | 69% |
The monthly return loses a bit over 20%, which would be tolerable. But the full-history drawdown doubles to -28% and the MC pass rate collapses to 69%. Even after removing the worst offender, the FX Connors block, the blend only recovers to a -25% drawdown and a 74% pass rate.
The core alone, by contrast, is close to cost-proof. Its index sleeve carries a PF of 5.77, swap is currently a tailwind, and the total return haircut stays around 7%. The verdict wrote itself: for steady withdrawals, run the core alone. Treat the aggressive blend as a regime-specific upside bet, with risk tightened further to about 0.002 (0.2% of capital) and its fragility fully understood.
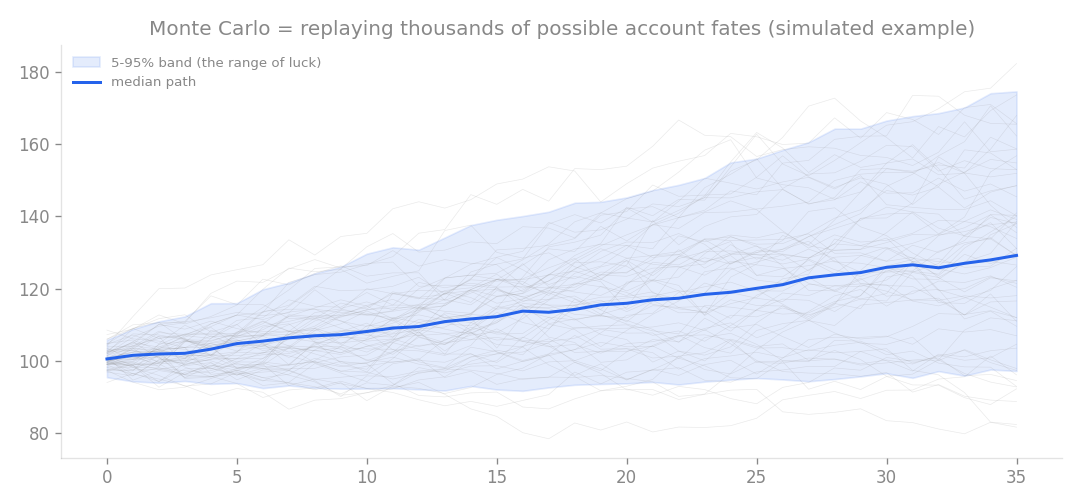
The MC pass rate replays thousands of alternate account histories. When costs pull it from 89% to 69%, the entire distribution of fates has shifted toward failure.
Study 203: making the engine itself tell the truth
Some time later, the cost campaign went one level deeper. Instead of stressing a particular system, I went after the optimism baked into the backtesting engine itself. Three changes.
First, gap fills: if price jumps over a stop-loss or take-profit level, the order now fills at the opening price beyond the level, not at the level itself. Second, exact swap accounting, charged every night a position is held (triple on Thursdays). Third, rollover spreads: entries during the expensive server hours around midnight now pay a spread multiplier. The then-current core (Core v1.6.0) was remeasured over 2015 to 2026.
| Configuration | Monthly return | PF | Max DD | MC pass rate |
|---|---|---|---|---|
| Old engine (optimistic) | 0.810% | 1.64 | -8.1% | 97.2% |
| New default (gap fills included) | 0.787% | 1.60 | -8.4% | 96.3% |
| Full stress (1.0 pip swap per night + rollover costs) | 0.630% | 1.42 | -14.6% | 85.8% |
The gap-fill correction cost only 0.023 points of monthly return. The old assumption of perfect fills was indeed too kind, but not by much. The variable that actually matters is swap. Sensitivity testing showed that a 0.5 pip per night charge shaves 0.078 points off the monthly return (roughly a tenth of it) and 3.6 points off the MC pass rate. For trend-following positions held for weeks, that small nightly toll is the single largest unknown in the whole cost picture.
Even so, the full-stress scenario still delivers 0.630% per month at PF 1.42 with an 85.8% pass rate. The edge does not die of costs. That structural confirmation, more than any single number, was the payoff. The new defaults (0.79% monthly, PF 1.60, MC 96.3%) became the baseline for all research since.
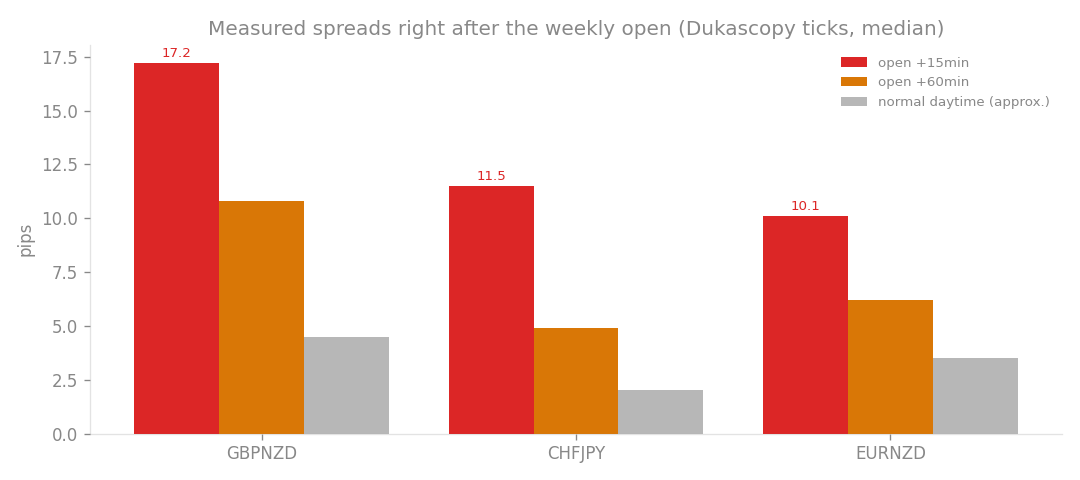
Measured spreads around rollover and the weekly open run several times their daytime size. Study 203’s midnight cost multiplier is grounded in these measurements.
What four studies bought
Three lessons run through the whole series.
- Costs attack drawdown before they attack returns. The monthly figure loses around a tenth, while the valley deepens by 1.5 to 2 points and doubles outright in the aggressive blend
- Holding period sets cost sensitivity. A 6.8-day core shrugs costs off; a 0.2-day rotation logic gets eaten alive
- The last unknown is swap. An assumption swing moves the monthly return by about a tenth, and only broker reality can settle it
Which defines the homework. The live EA logs every deal with the swap and commission actually paid. A few weeks of that data will let me calibrate the true cost per symbol and recompute the deployment plan from measurements instead of assumptions. The distance between a backtest and a live account is not something you guess across. You measure it.
This article consolidates studies 106, 107, 109 and 203.