
Changing only when and how much I withdraw cut my first prop payout from 530 to 169 days
Three studies that optimized nothing but the payout policy on a prop firm account: a cushion sweep worth +16% in monthly withdrawals, a 36% shorter challenge at the same pass rate, and a two-stage plan that reaches the first payout 3.1 times faster. Same system, same PF, free leverage.
I did not touch the trading logic. I did not change what the system risks per trade. And yet the median time to my first prop firm payout fell from 530 trading days to 169, roughly a third of the original wait. The only thing that changed was the payout policy: when to withdraw, and how much to leave behind.
Withdrawal rules sound like accounting trivia next to strategy hunting. I treated them that way myself, leaving a 10% setting untouched for the better part of a year without ever sweeping it. This article merges three studies (research notes 157, 158 and 161) into the story of how expensive that neglect turned out to be.
First time here? What you need to know
For new readers: this blog is a verification diary. I (one person) build my own automated FX trading program (an EA), statistically test trading methods, and publish everything, wins and losses alike. “Study N” refers to my numbered research log. Every figure below comes from Monte Carlo simulation, which resamples daily returns thousands of times to replay the whole range of fates an account could have had.
The stage is a prop firm. You trade a funded account provided by a company rather than your own capital, and you receive a share of the profits as payouts. Entry requires an evaluation (the challenge): on the standard plan I target, you pass by gaining 8% in Step 1 and 6% in Step 2, which promotes you to the funded account. Fail, and you pay a ¥12,500 fee to retake it. There is also a cliff: touch the daily loss limit even for a moment and the account is terminated.
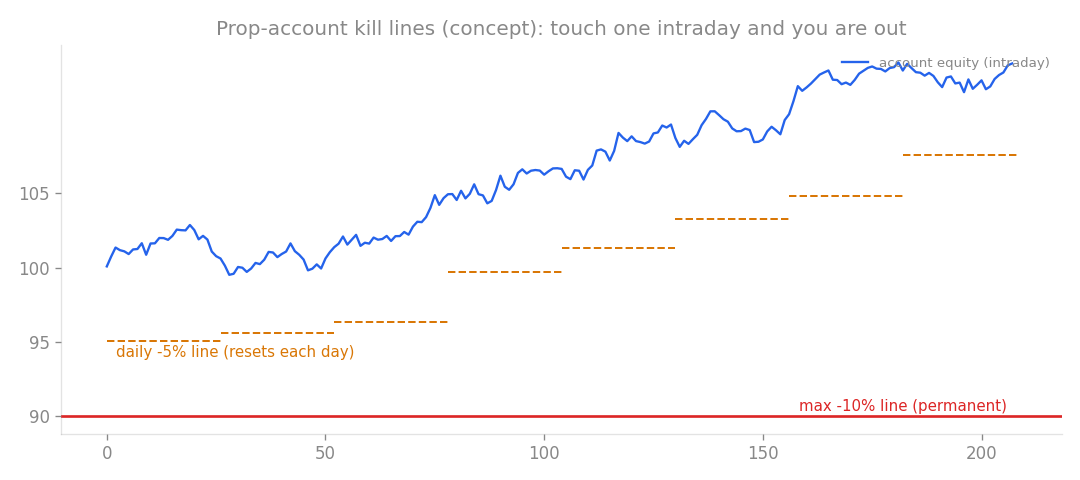
The termination lines of a prop account (concept diagram). This cliff is why both sizing and payout timing show up directly in the numbers.
Three terms. PF (profit factor) = gross profit over gross loss, above 1 means profitable. Dynamic k = a sizing rule that raises or lowers the lot multiplier with the account’s profit cushion, shaped by a base value kb and a ceiling cap. Flat guard = a defense that closes every position and stops for the day once the daily loss reaches a set level. The underlying system holds PF 1.64 and never changes in this article. Every improvement below comes purely from how the money moves.
Study 157: sweeping “how much to keep” found a free 16%
The first study is about the size of withdrawals. My rule had been to withdraw whatever equity exceeded 110% of the initial balance, in other words a retained cushion C of 10%. It was set back in study 148 and never compared against alternatives. So I swept cushions of 5 to 20% against lot ceilings (kcap) of 1.5 to 2.0.
| Cushion C | Lot ceiling kcap | Monthly payout | Ruin probability |
|---|---|---|---|
| 5% | 1.5 | inferior | 7.1% |
| 10% (old rule) | 1.5 | 1.000% | 4.3% |
| 15% | 1.8 | 1.161% | 4.9% |
| 20% | 1.8 | 1.103% | 4.5% |
The surprise sits in the relationship between the two columns. I had assumed a thicker cushion simply means less money withdrawn. In reality, C and kcap are not a trade-off: a thicker cushion supports a higher ceiling, because more buffer above the floor keeps aggressive sizing from turning into ruin. The cushion is not idle savings. It is the foundation that lets you press harder.
The new operating point is C = 15% with kcap 1.8. With the system unchanged at PF 1.64, the monthly payout rises from 1.000% to 1.161%, a 16% improvement, at a 4.9% ruin probability (5.5% under a harsher stress assumption). I run it manually rather than in the EA code: every two weeks, withdraw whatever equity exceeds the initial balance plus 15%. A 16% raise with zero changes to the logic is about as close to a free lever as trading offers.
Study 158: the same gear in the challenge phase, 36% faster at the same pass rate
Next, the money’s front door: the evaluation. The flat guard plus dynamic k combination had already proven itself on the funded side, so I applied it unchanged to the challenge (Step 1 +8%, then Step 2 +6%). Failures are judged on intraday account equity rebuilt from 1-minute bars, and every failed attempt pays the ¥12,500 fee again.
| Configuration | Pass rate | Median days to pass | Expected fees |
|---|---|---|---|
| Current fixed sizing | 95.9% | 255 trading days | ¥13,031 |
| kb 2.0 / cap 1.5 | 95.9% | 163 trading days | ¥13,031 |
| kb 2.0 / cap 2.0 | 94.9% | 124 trading days | ¥13,171 |
| kb 2.5 / cap 2.5 | 92.5% | not recorded | not recorded |
The kb 2.0 / cap 1.5 row is the striking one. Identical pass rate, identical expected cost, and the median passing time drops from 255 to 163 trading days, a 36% cut. Under a harsher stress scenario it holds 89.5% against the baseline’s 89.9%, effectively a tie. Raising the cap to 2.0 nearly halves the wait at 124 days, for a small dip in pass rate. Pushing to kb 2.5 / cap 2.5 degrades the pass rate to 92.5%, like a climber who sheds so much gear for speed that bad weather becomes lethal.
The verdict was almost boring. No special exam configuration needed. Bring the everyday setup into the challenge and you pass three to four months sooner, at the same pass rate and the same cost, with one less configuration switch to manage.
Study 161: change the objective, and 530 days become 169
The final study optimizes the whole journey, and it began with rewording the goal. Not “maximize monthly payouts” but “reach the first payout as fast as possible, then slow down”. With that objective, I simulated the entire path: Step 1, Step 2, funded account, first payout. Fail anywhere and the simulation pays the fee and restarts from Step 1, with the days still counting.
First, the sobering baseline. The old conservative approach (fixed sizing, accumulate a 10% cushion before withdrawing anything) reaches the first payout in a median of 530 trading days. About 25 months, most of it spent stockpiling the cushion. If the goal is a fast first payout, the payout policy itself has to change.
Switching to “withdraw at the first cycle that shows any profit” (Cf = 0) combined with dynamic k transforms the picture: kb 2.0 / cap 1.5 reaches the first payout in a median of 227 days, and kb 2.5 / cap 2.5 in 178. Because retakes are included, the probability of eventually getting there is near 100% in every configuration. The cost of aggression is just the increase in expected fees plus some calendar risk. Attacking the challenge is, in practice, almost free.
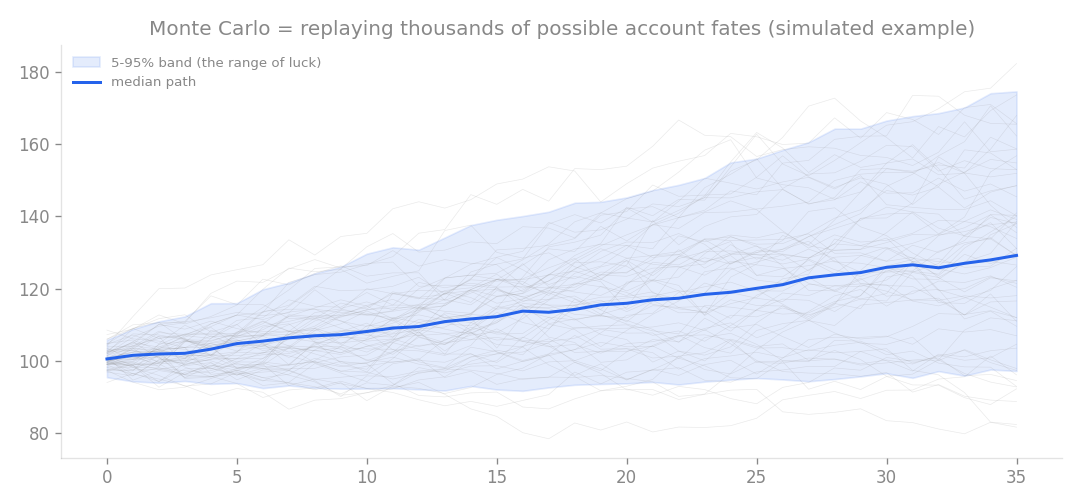
How Monte Carlo works (simulated example). The days-to-first-payout figures are medians of exactly this kind of distribution.
The most efficient path is a two-stage operation. Attack the evaluation at kb 2.5 / cap 2.5, then switch to kb 2.0 / cap 1.5 once funded and withdraw everything at the first profitable bi-weekly cycle. Median time to first payout: 169 trading days, about eight months. The chance of getting there within one year is 65.2%, the expected total fees are ¥13,244, and the median first payout is ¥12,094, so the first withdrawal roughly pays back the entry fees and everything after is accumulation. Under stress the plan holds at 199 days with 57.4%. Pushing the evaluation to kb 3.0 shaves it to 154 days for ¥860 in extra expected fees, a marginal trade I declined.
Sharp readers will object: didn’t study 158 call kb 2.5 / cap 2.5 too aggressive? It did, when the yardstick was the pass rate alone. Once the objective becomes days to first payout, a failed attempt just costs a fee and a restart, and the speed gain outweighs the pass-rate dip. Change the objective function and the optimum moves with it. That was the biggest lesson of the three studies.
The three-stage plan and the ledger
The final operating plan has three phases:
- Evaluation: kb 2.5 / cap 2.5, flat guard always on
- Funded until the first payout: kb 2.0 / cap 1.5, withdraw the full profit at the first profitable bi-weekly cycle
- After the first payout: switch to C = 15% with kcap 1.8 and settle into steady growth at 1.16% monthly payouts
The ledger for the whole arc: the trading system stayed frozen at PF 1.64, yet the robust monthly payout rose from 0.61% to 1.16% (a 90% increase, combining the risk-shape work with this payout optimization), passing comes three to four months sooner, and the first payout arrives in 169 trading days instead of 530.
Two caveats. These figures assume the standard evaluation rules, so check your provider’s official terms (payout waiting periods, minimum trading days and the like) before attempting this. And “swift” style plans with halved loss limits are a different animal entirely, excluded from this optimization.
Payout policy needs no new edge, no new indicator, no new market. Same system, same risk, different plumbing for the money, and the first withdrawal arrives three times sooner. I have stopped thinking of withdrawal rules as accounting trivia.
This article consolidates studies 157, 158 and 161.