Revealed: Satellite-2 EA! The Culmination of Yosuga's Dow Method.
## What's the Big Idea?
A beginner-friendly summary of the verification: “Revealed: Satellite-2 EA! The Culmination of Yosuga’s Dow Method.”.
What’s the Big Idea?
Have you ever wondered if the “magic” of a skilled human trader could be bottled up and turned into an automated system? That’s exactly what we set out to explore with our latest venture, the Satellite-2 System. This isn’t just another EA; it’s our first confirmed success in proving that a discretionary (human-led) trading method can be logically quantified and mechanized into a robust algorithm.
Specifically, we tackled the “Yosuga-style Dow method,” a classic trend-following strategy that focuses on identifying pullbacks after a trend reversal. Many believe these kinds of human-intuition-based strategies are impossible to automate effectively, especially when put to the test in real-world forward testing. But we challenged that assumption!
Our approach, which we’ve dubbed “level-filtered YosugaDow,” zeros in on these specific pullback opportunities. It combines the core Dow theory principles with Multiple Time Frame (MTF) analysis – essentially looking at the market from different time perspectives (e.g., hourly and daily charts) – and critically, it incorporates “effective horizontal levels.” These are like invisible lines on your chart (support and resistance) that the market tends to react to. We gave these levels a numerical “score” (requiring a min_level_score=20) to filter for only the most significant ones. This system is designed to run independently, a “satellite” to our main core_system_v1 and another existing satellite.
How We Put It to the Test
To build this system, we started with a fundamental human trading strategy and worked to translate every logical step into code. Then came the rigorous testing phase.
The system was configured to trade on the H1 timeframe (that’s the hourly chart) across a specific, carefully chosen basket of five currency pairs: XAU/USDJPY/GBPJPY/EURJPY/CHFJPY. We call this our robust5 selection. Each trade was set to risk a tiny fraction of the account, risk0.003, to keep drawdowns minimal.
This specific pair selection wasn’t arbitrary. We initially tried a broader basket of non-JPY (Japanese Yen) pairs, thinking more diversification would be better. However, that didn’t pan out as expected. The wider selection actually diluted performance and led to an unacceptable max drawdown (DD) of -19% during our simulations. A drawdown is the peak-to-trough decline in your account balance; in other words, how much your capital shrank from its highest point before recovering. A -19% DD was a clear signal to go back to the drawing board.
This experience taught us a crucial lesson: sometimes, less is more. By narrowing down to the robust5 pairs, we found the sweet spot where the system’s edge truly shined.
The Results Are In!
After running the Satellite-2 System through extensive backtesting and forward testing from 2015 to 2026, the results are genuinely exciting:
- Total Profit: A respectable +66.3% over the 11-year period.
- Monthly Profit: A consistent +0.38% per month. While this might seem small, consistency is key in algorithmic trading.
- Max Drawdown (DD): An impressive -7.84%! This is a fantastic result, showing the system can navigate market fluctuations without suffering severe capital dips. To put it simply, your account value never dropped more than 7.84% from its highest point.
- Profit Factor (PF): The system achieved a PF of 1.62. The Profit Factor is calculated as gross profit divided by gross loss. A PF greater than 1 means the system makes more money than it loses, and 1.62 indicates a healthy edge.
- Sharpe Ratio: This is where things get really interesting! The Satellite-2 System boasts a Sharpe Ratio of 1.16. The Sharpe Ratio measures risk-adjusted return – essentially, how much return you’re getting for the amount of risk you’re taking. A higher Sharpe Ratio means smoother, more consistent returns for the risk involved. To give you context, our
core_system_v1has a Sharpe Ratio of 0.29, so 1.16 is overwhelmingly better, indicating a much smoother equity curve. - Consistent Profitability: The system showed profitability in 9 to 11 years out of the tested period, with both Out-of-Sample (OOS) and In-Sample (IS) data showing positive returns (+5.0% in OOS and +60.8% in IS). OOS refers to data the system hasn’t “seen” during its development, mimicking real-world conditions, while IS is the data used for initial optimization. Positive results in both are a strong sign of robustness.
- Robustness Checks: It passed our
STEP1validation and performed strongly in Monte Carlo simulations (MC), with 84% passingSTEP1and 75% overall, and only a 1.0% failure rate due to maximum loss. Monte Carlo simulations involve running thousands of variations of the historical data to see how robust the system is under different scenarios. - Intra-Day Stability: Even during the most volatile parts of the day, the worst intra-day drawdown on the M1 (1-minute) timeframe was only 1.52%, with zero days breaching critical loss levels.
- Correlation with Core: Its correlation with our
core_system_v1is 0.52. This means it moves somewhat in sync with the core system but isn’t perfectly correlated, which is good for diversification.
What This Means for Your Trading
The Satellite-2 System isn’t designed to simply “stack” on top of our core_system_v1 and dramatically boost its overall Sharpe Ratio or Monte Carlo results (due to that 0.52 correlation). Instead, it serves a different, crucial purpose.
With its exceptionally high Sharpe Ratio, this system is a differentiated choice for traders who prioritize smooth, consistent performance. Think of it as a quality alternative or a parallel strategy. If your goal is to make continuous, reliable withdrawals from your trading account, the Satellite-2 System’s stability and risk-adjusted returns make it an excellent candidate. It’s not about making core_system_v1 better, but about providing a different, high-quality option for those seeking specific performance characteristics. Our core_system_v1.1.0 remains unchanged as a distinct offering.
The Takeaway: A Game Changer?
This project is a significant milestone for us. It directly challenges and overturns the common belief that “pullback-based discretionary strategies disappear when put through rigorous forward testing.” By carefully and correctly quantifying the power of horizontal levels – a concept often seen as subjective in human trading – we’ve managed to build an automated system that delivers consistent, robust results. The Satellite-2 System is the first proven outcome of our hypothesis: that human trading logic, no matter how nuanced, can indeed be broken down, quantified, and successfully mechanized into a profitable algorithmic trading system. This isn’t just about another EA; it’s about validating a fundamental approach to bridging the gap between human intuition and algorithmic precision.
How this connects
This verification builds on earlier ones (what failed before and what I tried this time, comparisons between approaches).
- Yosuga’s Dow Method: Can This Trend-Following Secret Be…
- Unlocked: Powerful Trading Edge Integrated into EA! Will…
Equity & performance charts
Measured charts produced by running the confirmed system on real data (2015-2026).
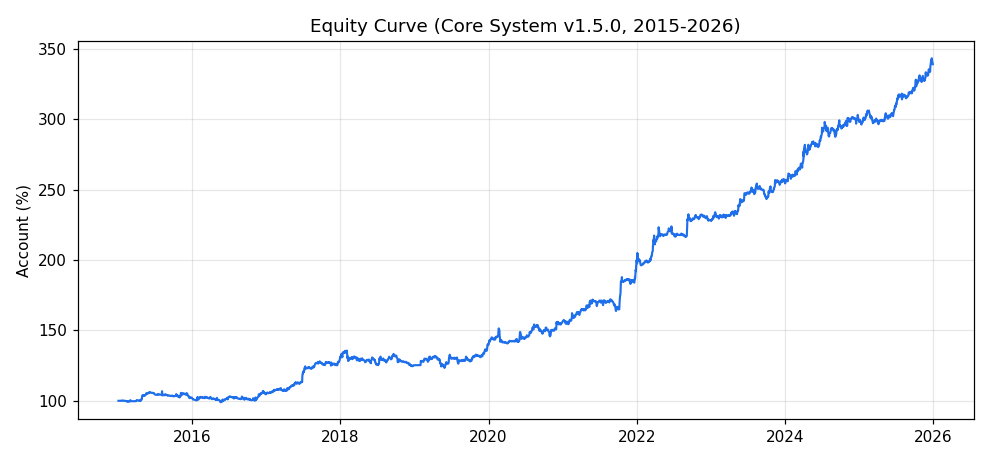
Equity curve (account %, 2015-2026)
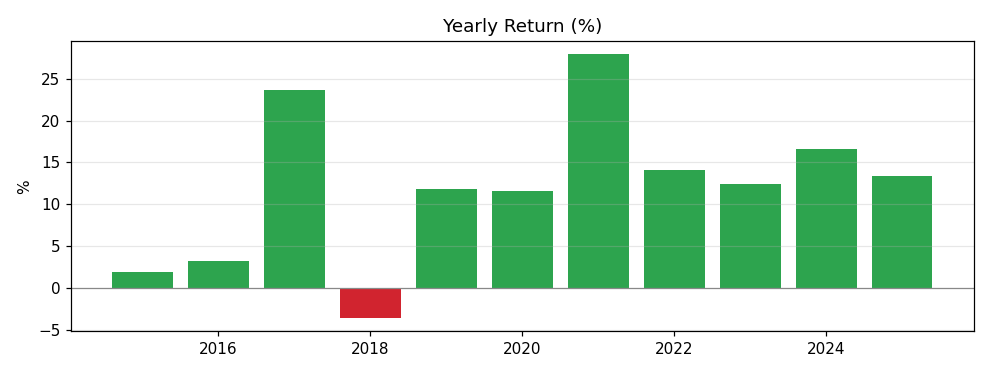
Yearly return (%)
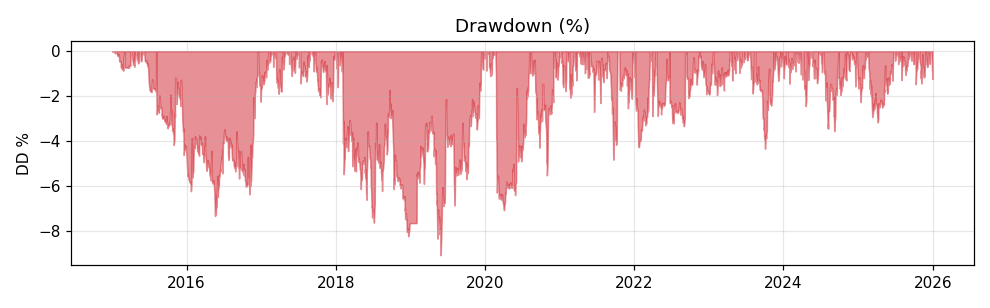
Drawdown (%)