Satellite System Unveiled: The Secret to More Stable EA Profits!
## What's the idea?
A beginner-friendly summary of the verification: “Satellite System Unveiled: The Secret to More Stable EA Profits!”.

Breakout entry example (XAUUSD daily, real data): buy when price breaks above the recent high.
What’s the idea?
We’re always looking for ways to make our algorithmic trading (EA) portfolio more robust and less risky. Our main “core” systems, like breakout strategies, might be great, but they often move in similar ways. What if we could add a second system that behaves differently, even if it only offers small gains? That’s the idea behind this “satellite” system: to find tiny, uncorrelated “edges” in the market and bundle them together to diversify our overall portfolio. This particular satellite system is built around a few specific concepts:
- Bollinger Band Mean Reversion (D1): It looks for price extremes using Bollinger Bands on the daily (D1) timeframe, betting that prices will revert back to the average. Think of it like a rubber band snapping back.
- Monthly & Seasonal Timing: It incorporates timing elements around month-ends/starts, and specifically focuses on April and December, where certain market patterns might emerge.
- USD Trend Focus: It only trades GBPUSD and USDJPY, and specifically considers the overall USD trend for its decisions. The goal isn’t for this system to be a massive profit engine on its own. Instead, it’s designed to find those “small edges” – like finding loose change on the street – that, when combined, offer a unique behavior profile, ideally uncorrelated to our main strategies.
How I tested it
To see if this satellite system had any merit, I put it through an extensive backtest, simulating its performance over an 11-year period.
- Low Risk Setting: I set the risk very low, at 0.003 (meaning a tiny fraction of the account equity per trade), which is crucial for a system meant to be a diversifier, not a primary profit driver.
- Key Metrics: I paid close attention to a few critical performance metrics:
- Maximum Drawdown (MaxDD): This is the biggest peak-to-trough drop in the account balance during the test. A lower MaxDD means less risk and less emotional stress.
- Profit Factor (PF): This tells us how much gross profit was generated for every dollar of gross loss. A PF of 1.16, for example, means for every $1 lost, the system made $1.16. Anything above 1.0 indicates profitability.
What happened?
The 11-year backtest revealed some fascinating insights:
- Overall Performance: The system generated a total return of +14.2% over 11 years.
- Monthly Average: This translates to a modest average monthly return of approximately +0.10%. In other words, it’s a very slow and steady grinder, definitely not a get-rich-quick scheme!
- Risk Profile: The maximum drawdown (MaxDD) was a respectable -8.3%. For a system running for over a decade, that’s a fairly controlled level of risk.
- Profit Factor: It achieved a Profit Factor (PF) of 1.16. This means that for every dollar it lost, it made $1.16. So, it was consistently profitable, even if the individual profits were small.
- Correlation with Core: Crucially, its correlation with our “core” breakout system was only 0.29. This is fantastic! A low correlation means the satellite system isn’t moving in lockstep with our main system. When one is up, the other might be down, or simply doing its own thing, which is exactly what we want for diversification.
- Standalone Viability: While it passed our internal “Step 1” validation, it’s clear this system isn’t designed to be a standalone powerhouse. Its annual return is only about 1.2% (0.10% x 12 months). This means it would be very slow to pass a typical prop firm challenge on its own (it only succeeded in about 17.6% of Monte Carlo simulations for that goal). A Critical Discovery: The Importance of Exclusion! Here’s where it gets really interesting: I found that it was absolutely essential to exclude certain “losing components” from the system – specifically, trading based on overall USD trends that moved in both directions. If I included these components, the system’s performance plummeted, resulting in a devastating -25% MaxDD and a clear disqualification. This highlights a vital lesson: you can’t just bundle any small edge. You must carefully identify and only include the positive, uncorrelated components. It’s like sifting for gold; you have to discard the worthless dirt to find the valuable nuggets.
What I learned
This satellite system, despite its humble individual returns, proved its value not as a standalone profit engine, but as a powerful diversification tool.
- Small Edges Add Up (and Diversify!): While 0.10% a month might seem insignificant, when combined with your main strategies, these small, uncorrelated gains can make a big difference. It’s like having multiple streams of income, even if some are tiny – they all contribute to your overall financial health.
- Reduced Overall Risk: The low correlation (0.29) with our core system is the real gem here. By combining this satellite with our main strategies, we can expect a reduction in the combined maximum drawdown (DD) of our entire portfolio. Imagine having a summer business and a winter business; when one slows down, the other might be picking up, smoothing out your overall income.
- Boosting Core Performance: A lower overall portfolio drawdown has a huge benefit: it allows us to potentially increase the leverage on our core systems. If our overall risk is reduced, we can safely allocate more capital or use slightly higher leverage on our main profit drivers, which in turn boosts the overall performance of our entire trading operation.
- The Art of Exclusion: The lesson about excluding losing components (like the problematic USD trend elements) is paramount. It reminds us that building robust EAs isn’t just about finding profitable ideas; it’s also about meticulously identifying and discarding anything that detracts from the overall positive edge. We only want to bundle those truly positive, uncorrelated pieces. In short, this “satellite” system isn’t going to make you rich overnight. But by intelligently integrating it into a broader portfolio, it has the potential to make your overall trading journey smoother, less risky, and ultimately, more profitable. It’s all about building a well-rounded, resilient trading portfolio!
Equity & performance charts
Measured charts produced by running the confirmed system on real data (2015-2026).
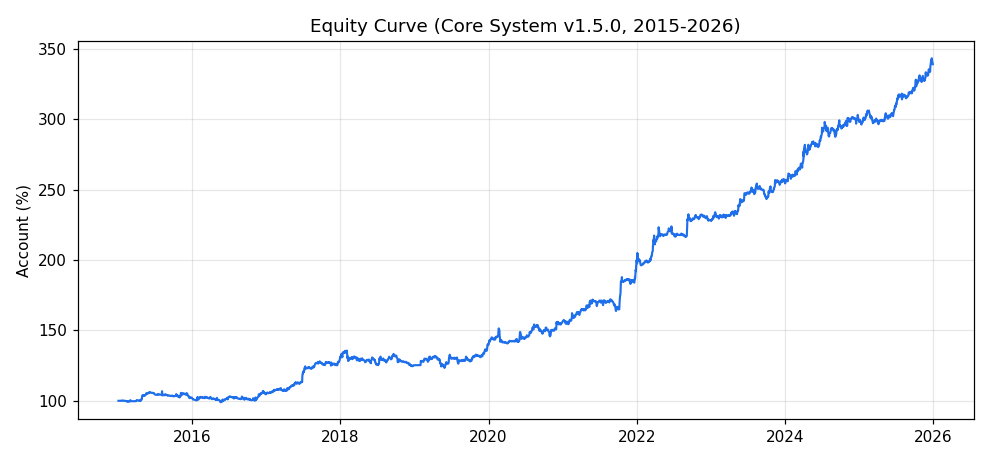
Equity curve (account %, 2015-2026)
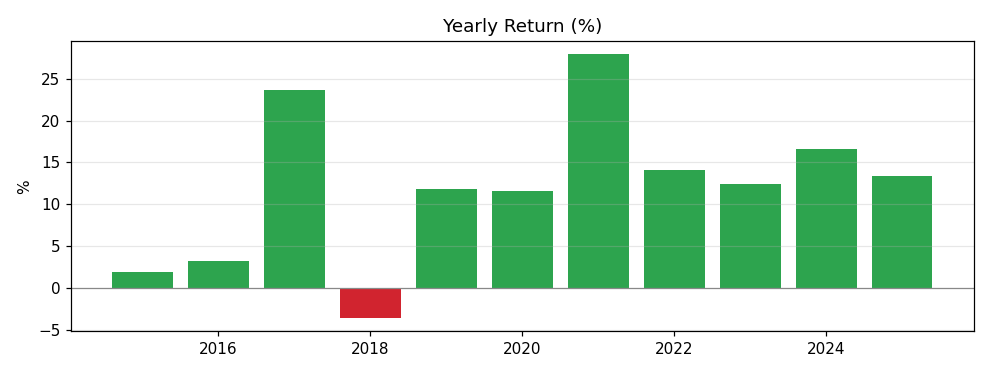
Yearly return (%)
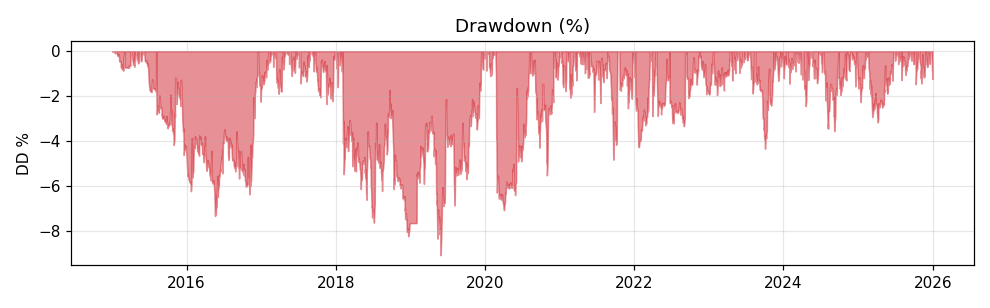
Drawdown (%)