
How the testing works — why can you trust these results?
Walk-forward, forward testing, M1 intraday checks, Monte Carlo, prop-firm evaluation. A beginner-friendly tour of the methods that show up across these articles.
Across this site you’ll see phrases like “vanished in forward testing,” “failed the M1 intraday check,” or “Monte Carlo pass rate of X%.” Here’s what each of those means, as plainly as I can put it. They’re all gates designed to keep us from being fooled by a fake edge.
1. Use clean data
If the underlying data is broken, the test is meaningless. I once had gold data with anomalies that made a strategy look highly profitable — when I dug in, most of the “wins” came from those bad values. So I detect and remove abnormal bars before testing.
2. Walk-forward / forward testing
This is the big one. In short: decide the rules on the past, then test on a future you haven’t looked at.
- Example: pick the best settings on 2015–2020 data → test those settings on unseen 2020–2025.
A naive backtest picks the best settings over the whole period, which is basically hindsight. Walk-forward never peeks at the future, so it shows whether something actually holds up. In the stricter “full forward test,” even the choice of which symbols to use is made only from the past. Many ideas quietly die here.
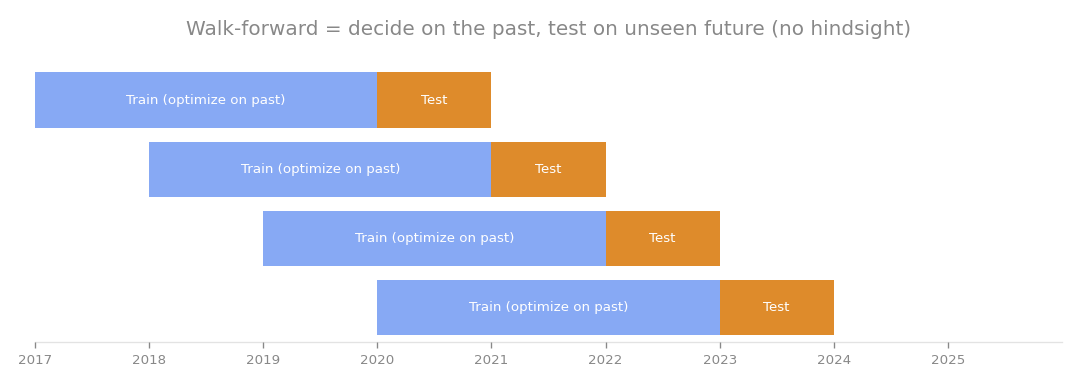 Decide settings on a past window, validate on the unseen future, then roll forward and repeat.
3. Check intraday risk on the 1-minute (M1) chart
Prop firms have rules like “lose more than X% in a single day and you’re out.” Looking only at daily bars hides the moments inside a day where open profit is given back and you’re temporarily deep in the red.
So during a position I zoom into the 1-minute chart and reconstruct how the account moved intraday. That catches cases that “look unharmed on the daily chart but actually busted mid-day.”
4. Monte Carlo (probability of passing)
One good run in the past could be skill or luck. So I reshuffle the past returns to build thousands of “alternate futures” and count in how many of them the strategy would pass the prop challenge. That’s where “pass rate X%” comes from.
5. Portfolio engine (realistic account management)
Testing each symbol separately and adding up the results understates true risk (it misses the days when everything loses together). So I run all symbols on one shared account, bar by bar, and judge by the whole-account drawdown.
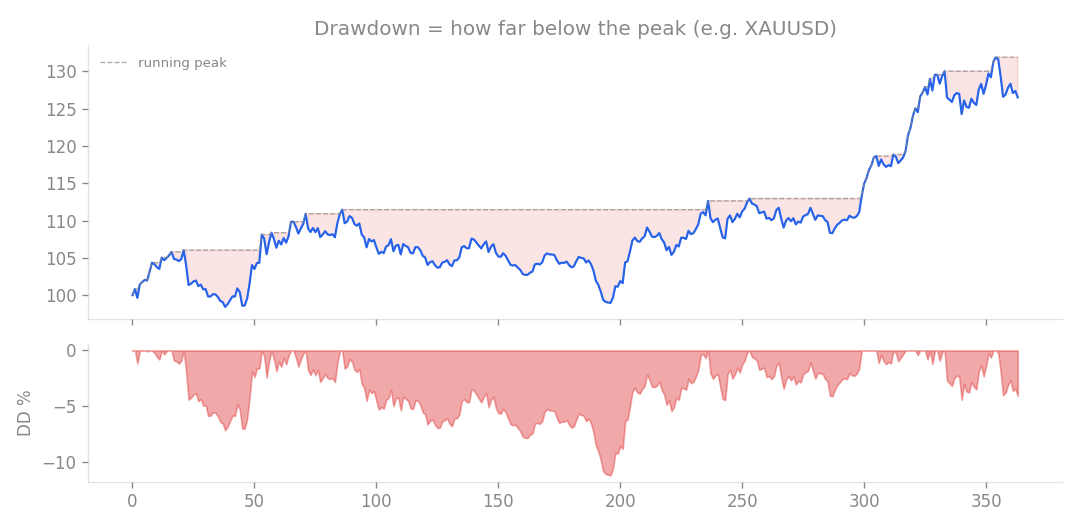 Drawdown = how far you’ve fallen from the peak. It maps directly to prop limits like “max -10%.”
In short
Only strategies that pass all of these get treated as “real candidates.” If they trip on any single gate, they’re out.
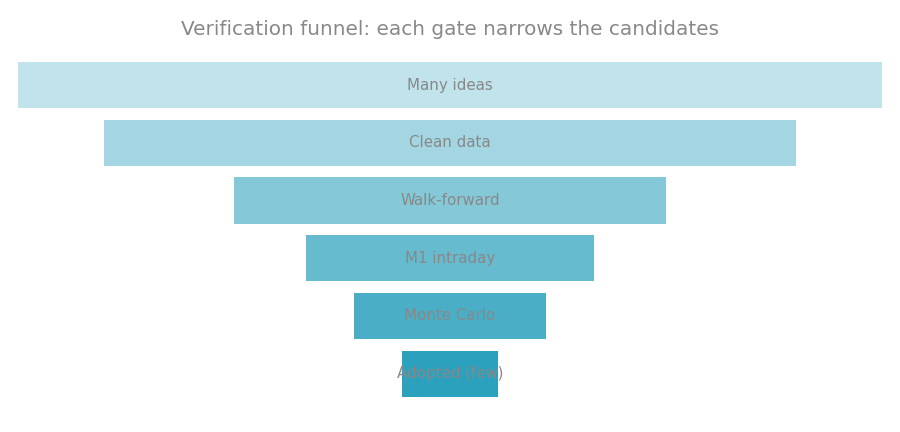 Lots of ideas go in; each gate narrows them down. Only a few make it through.
This multi-gate process is dull, but it’s why we can reject “looks-good-only” strategies with fairly high accuracy.