
An index sleeve broke my 0.47% monthly ceiling, then shorting indices sank to PF 0.13
The four-study path that took a stock index sleeve from idea to production: the integration test that broke the return ceiling, the 1-minute intraday stress test (and the bug it exposed), the cost sensitivity check, the implementation spec, and the index-short hedge that collapsed to PF 0.13 along the way.
My trading system was stuck at a monthly return of 0.47% no matter what I tuned. Adding one stock index sleeve on the long side lifted that to 0.53% monthly at PF 1.45, and the drawdown got smaller at the same time, from -9.0% to -8.3%. Meanwhile, a strategy that shorted the very same indices finished at -29.6% overall with a PF of 0.13. Same market, opposite direction, opposite fate.
This article tells the full genealogy: how the index sleeve earned its place in my portfolio across three studies (59, 68 and 108), and how the index-short idea died in a fourth (study 111) running quietly in the background.
First time here? What you need to know
For new readers: this blog is a verification diary. I (one person) build my own automated FX trading program (an EA), statistically test trading methods, and publish everything, wins and losses alike. “Study N” refers to my numbered research log.
Three prerequisites. A sleeve is a component strategy inside a portfolio, something you attach or remove like a sleeve on a garment; my EA runs a bundle of FX-centric sleeves I call the core system. A prop firm is a company that trades you their capital under strict rules, typically a -5% daily loss limit and a -10% overall limit, and touching either line once means disqualification. And the metrics: PF (profit factor) = gross profit over gross loss, above 1 means profitable. DD = drawdown, the decline from an equity peak. MC pass rate = the probability of passing prop-firm rules, estimated by resampling daily returns.
Uncorrelated indices broke the 0.5% ceiling (study 59)
The starting point: the core system alone earned 0.47% monthly with a -9.0% drawdown and an 85.1% MC pass rate. Every refinement I threw at it bounced off an invisible ceiling around 0.5% per month, which was starting to look like the limit of what this price data could give.
Then I bolted on an index sleeve. The rule is plain daily-bar trend following: buy three US stock indices (the US3) only while price sits above the 200-day moving average. Crucially, it runs as a separate stream that is nearly uncorrelated with the FX core, meaning the two do not move in lockstep.
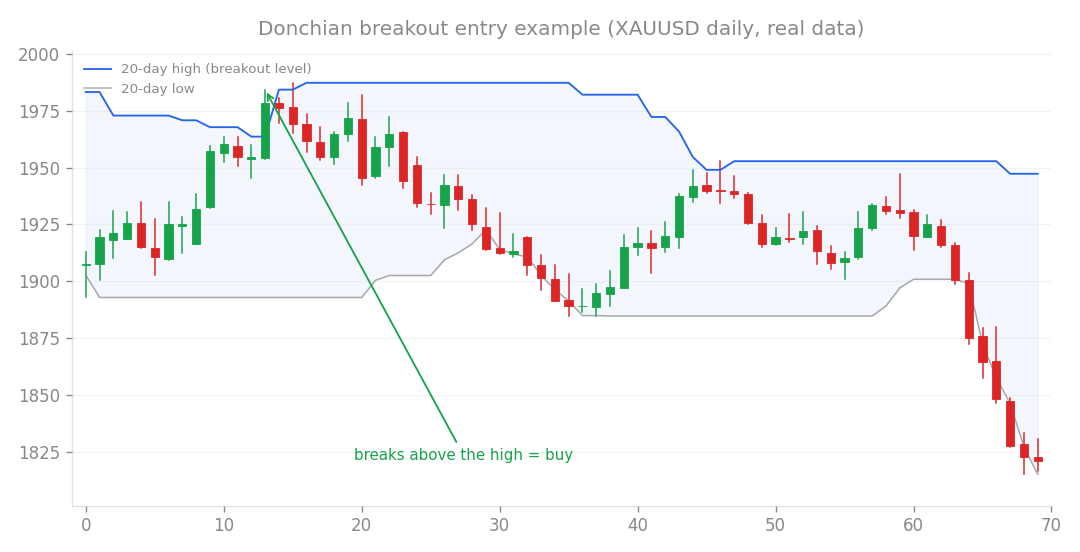
The flavor of entry involved. The index sleeve is the same family: slow, daily-bar, long-only trend following.
| Configuration | Monthly return | DD | PF | MC pass rate |
|---|---|---|---|---|
| Core system alone | 0.47% | -9.0% | - | 85.1% |
| Core + indices (risk 0.005) | 0.53% | -8.3% | 1.45 | 89.5% |
| Core + indices (risk 0.008) | 0.63% | -9.8% | - | 88.0% |
Look at the risk 0.005 row (0.005 is a raw fraction, 0.5% of capital per trade). Monthly return up from 0.47% to 0.53%, drawdown down from -9.0% to -8.3%, MC pass rate up from 85.1% to 89.5%. Every metric improved at once, roughly a 13% lift in monthly terms. Normally more return costs more risk; mix in an uncorrelated asset and you get more return with less drawdown simultaneously. The diversification textbook, confirmed in my own measurements.
So, instant promotion? Not yet. One thing blocked it: the index results existed only on daily bars. Indices gap and spike violently, and a system that looks unharmed on daily closes can still touch the -5% intraday disqualification line when you rebuild the account equity minute by minute. Earlier studies had shown me exactly that failure mode, daily-bar wins turning into intraday disqualification. So I fixed the recommended configuration (core at risk 0.003, indices at risk 0.005) and put the promotion on hold.
The minute-by-minute test found my own bug first (study 68)
Time for the 1-minute (M1) intraday check. I pulled M1 data for the S&P 500, DAX and Nikkei 225, years 2010 through 2018, from a public GitHub dataset, and the very first runs showed a -5.99% daily crash and ten separate days breaching -5%. Was the index sleeve disqualified after all?
No. The culprit was a bug in my own testing engine. When summing intraday open profit across positions, the code ignored the fact that different symbols trade in different sessions. At any minute without a tick for a symbol, that position’s open profit was counted as zero. Since indices trade in separate Asian, European and US sessions, open profits flickered on and off, painting fake cliffs into the equity curve. The real position swing was at most 0.31%. I fixed it by putting every position on one unified timeline and forward-filling the gaps. The FX core barely moved after the fix, from 4.05% to 4.00%, confirming backward compatibility for 24-hour markets.
A close call worth remembering. This bug exaggerated risk, so it only cost me a scare. Had it worked in the other direction, hiding risk, I might have promoted something dangerous. Distrusting the measuring instrument itself is part of the job.
Now the real test. The 2015 to 2018 window contains the August 2015 flash crash, Brexit, and the February 2018 volatility shock known as Volmageddon. With risk at 0.005:
| Metric | Result |
|---|---|
| Worst daily loss | 2.60% (February 2018) |
| Days breaching -5% | 0 |
| Days breaching -10% | 0 |
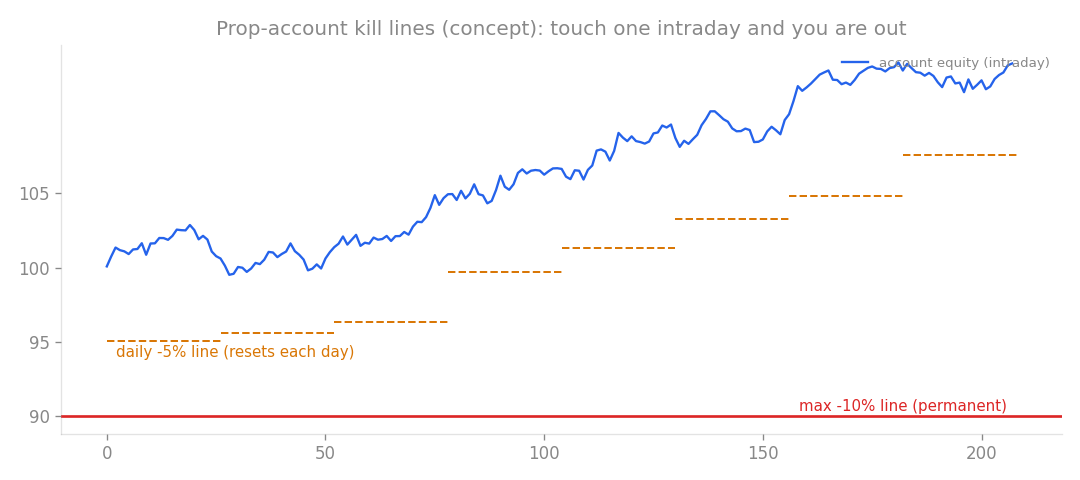
The prop rules judge you on intraday touches, not daily closes. That is why daily-bar results alone can never justify a promotion.
Even the single worst day left nearly half the distance to the -5% line untouched. Long-only index trend following passed the intraday exam. The remaining homework at that point, the 2019 to 2025 window with the March 2020 COVID crash and the higher-volatility production symbols like the Nasdaq, was cleared in a follow-up study, and the index sleeve was formally promoted into the portfolio.
A cost wall that gets hit 39 times in 11 years (study 108)
After promotion comes productionization. The indices trade as CFDs (contracts for difference), so I measured how much spread and slippage (the gap between your order price and your fill price) would eat.
The answer: almost nothing. Loading a harsh 20 points of slippage onto every trade only moved the PF from 5.77 to 5.09. The reason is frequency. This sleeve makes 39 trades in 11 years, riding multi-month trends on daily bars. Costs are a toll paid per trade, and a strategy that rarely passes the toll booth barely feels it. The flip side is a lesson that kept recurring in later research: the shorter your timeframe, the taller the cost wall.
On the implementation side I settled on a thin-client design: a Python server does the thinking, and a lightweight EA only places the orders. The heart of it is the daily overlay. Two multipliers, a vol-target factor (lot sizing scaled to recent realized volatility) computed from account equity and an equity filter factor driven by the US500 daily trend, are calculated from the previous day’s confirmed values and held fixed through the day. Live risk was set at 0.0025 (0.25% of capital). The spec document also lists the traps: currency conversion mistakes, rapid-fire duplicate orders, multi-timeframe data consistency, and index CFD contract quirks. With that, every cost-related concern (spread, slippage, swap, index CFD friction) was cleared.
And what if you short the same indices? (study 111)
That was the adoption story. In parallel, I tested the mirror image: shorting indices.
The hypothesis was respectable. Indices do produce sharp, sustained downtrends, late 2018, 2020, 2022. A trend-following short strategy might monetize crashes and act as a negatively correlated hedge, a component that profits precisely when everything else bleeds, like an insurance policy.
The measurement: -29.6% over the full period, PF 0.13. Thirteen cents of gross profit for every dollar of gross loss. And the crash years it was built for delivered almost nothing: -1.2% in 2020, +0.1% in 2022 across two trades.
The root cause is the speed of index crashes. They are V-shaped, falling fast and snapping back fast. Trend following is reactive by definition, so by the time a short signal confirms, most of the decline is already spent, and the rebound squeezes the position out. Between crashes, the long-term upward drift of stock indices grinds away at short positions day after day. The correlation with my core system was indeed -0.11, so it did move opposite. But a hedge that moves opposite while losing big is not a hedge. It replayed a lesson from an earlier study word for word: diversifying into a losing strategy just means losing money in a different place.
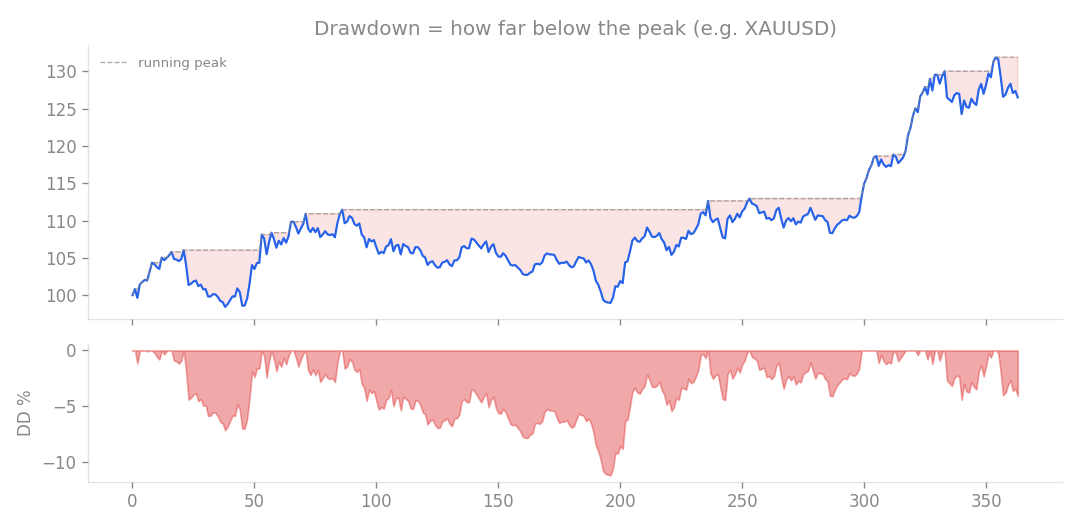
A hedge that digs its own drawdown defeats the purpose.
What the genealogy taught me
Put the four studies side by side and the line between adopted and rejected is sharp.
- The ceiling fell to an uncorrelated asset, not to a better tweak. The move from 0.47% to 0.53% monthly (PF 1.45) looks small, but every metric improving at once is a qualitative change
- The promotion gate was measured intraday risk. Daily-bar performance means nothing if minute-level equity touches the disqualification line, and finding my own measurement bug was part of earning that trust
- Cost resilience is set by trade frequency. Thirty-nine trades in 11 years shrugged off 20 points of slippage, PF 5.77 to 5.09
- The same market is a different animal in the other direction. The edge in indices lives on the long side only; the short side scored -29.6% at PF 0.13
The index sleeve went on to live inside the core system, where it still runs today. And the conclusion that shorting acts as a drag on performance has survived every test since. The robust edge in price is long-side trend following, and these four studies are the clearest specimen of how I got to that conclusion.
This article merges studies 59, 68, 108 and 111.