
Fourteen pre-registered hypotheses, fourteen losses, still the best search method
Three full rounds of hypothesis-first edge hunting: register the thesis and kill criteria before testing, seal the out-of-sample data, record every trial. A perfect-looking candidate dying at the final gate, tick data unmasking three ghosts, a map of market walls drawn in losses, and the first true survivor that followed.
I rebuilt the edge-hunting process from scratch and ran three rounds, fourteen hypotheses. Final score: zero wins, fourteen losses. A shutout. And I still rate it the strongest search method I have ever used, because every loss meant something, and because immediately afterward the same framework produced its first genuine survivor.
This article is the full record of the three rounds (research notes 244, 245, 246), plus an explanation of the method itself.
First time here?
Context for new readers: this blog is a verification diary. I (one person) build my own automated FX trading program (an EA) and statistically test trading methods, publishing wins and losses alike. “Study N” refers to my numbered research log. Three terms carry the article: PF = gross profit over gross loss (above 1 is profitable), OOS = untouched answer-key data sealed away from rule selection, and ATR = a symbol’s normal range of movement, used as the yardstick for comparing effect sizes against costs.
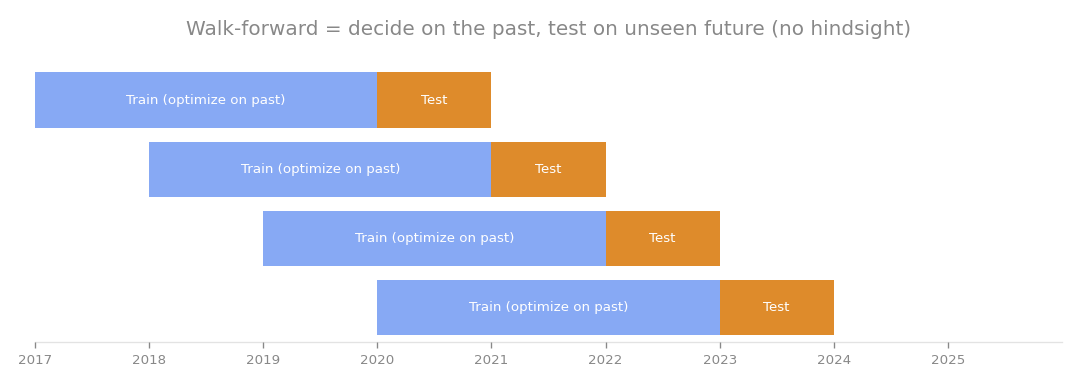
The heart of the method: out-of-sample data stays sealed until the final gate, and the seal breaks exactly once.
Why change the method at all
The workhorse until then was the census: test tens of thousands of candidates at once and let statistical correction pick survivors. Powerful, but with two limits. First, however strict the correction, a candidate with no story for WHY it works is hard to trust. Second, hypotheses finer than the census mesh, structural reads like “this specific flow on this specific weekday”, slip through the net entirely.
So I imported the protocol of experimental science: pre-registration. Four rules.
- Before testing, write down the structural story of why the edge should exist
- Freeze the test specification (data, thresholds, costs) and the kill criteria in advance
- Seal the out-of-sample data until the final phase; the seal breaks once
- Log every trial, failures included, in a ledger
Rule 3 does the heavy lifting. It makes the thing humans do unconsciously, nudging the spec after peeking at data, structurally impossible.
Round 1: nine losses and a map of walls (study 244)
The opening slate: nine hypotheses, each with a plausible structural story. Holiday-gap fades, Friday-close flow reverting on Monday, volume-climax reversals, metal market-break gaps, JPY-cross cascades, end-of-day concentration displacement, weaponizing the equity-shock signal, and more.
All nine died in in-sample screening. But look at what the deaths contained.
- The H1 cost wall, about 0.195 ATR. The Friday-flow reversion is real (raw t=+3.6) yet its +0.07 ATR effect cannot reach the wall. Microstructure anomalies frequently exist and remain untradeable at retail spreads; now that is a measured number
- Boundary liquidity is about order accumulation time. A one-hour market break creates no distortion, a 24-hour holiday produces continuation, and only the 48-hour weekend produces reversion. For the first time, there was a structural explanation for why the deployed weekend-gap fade is its family’s sole survivor (the weekend-gap fade, the one boundary-type rule live in my EA, trades the refill of the price gap between Friday’s close and Monday’s open)
- The bid-quote trap. Boundary-flavored signals easily mistake the mechanical sinking of the bid during spread blowouts for real price movement. Direction-symmetry checks and delayed measurement became mandatory tollgates for all boundary hypotheses
As a byproduct, an audit of the live weekend-gap sleeve firing after holidays came back clean: 16 real occurrences, +6.7R total, the strict gap condition naturally filtering out the bad events. No change needed.
Round 2: watching a perfect candidate die (study 245)
Three hypotheses in round two, and the method’s defining moment.
Fading index opening gaps (betting on the fill) measured significantly backwards: t=-2.84. Index gaps do not fill; they run. So the sign-flipped gap-and-go, trading WITH the gap, was formally registered as a derivative hypothesis. This matters: an idea born from looking at data gets registered along with its origin story and held to stricter scrutiny, not quietly slipped into the pipeline.
And it was formidable. Selection period t=+3.7. Eight profitable years out of eight. Consistent across five indices. A plateau under threshold shifts. A pass under cost stress. It ticked every box of a “perfect-looking” candidate I know of, cleared every intermediate gate, and became the first hypothesis in the program’s history to reach the unsealing.
The seal came off. Expected value: decayed to 44% of in-sample. Risk-adjusted: 40%. The pre-committed pass bar, less than 50% Sharpe decay, was missed. Discarded, per the rules.
A confession: the out-of-sample numbers alone are still positive (+0.033 ATR, 55% win rate). My former self might have shrugged and shipped it. But witnessing that a flawless in-sample robustness profile guarantees nothing is precisely what the seal is for. Later, an independent tick-data feed reproduced both the in-sample edge and the out-of-sample death, confirming the decay as the market’s truth rather than a data quirk. A revisit is booked for late 2027, when three more years will have accumulated.
The other two hypotheses, the gotobi fixing-day drift (control-adjusted edge insignificant: long since consumed by the market) and the fade side, also died. Zero wins again, but the discipline had earned its keep in live action.
Round 3: tick data unmasks the ghosts (study 246)
Round three brought a new microscope, tick data (raw quoted prices), to judge two new hypotheses and settle three dangling questions at once.
The new pair died quickly. Gold-silver ratio extremes continue rather than revert (t=-2.47 the wrong way). The supposed US-to-overseas next-day index spillover measures zero on real sessions for Japan and Germany, and the UK positive was an echo artifact of 24-hour bars containing the following US session.
The three tick verdicts were the main event.
- The Monday triangular-parity divergence: a promising arbitrage-flavored signal from round 1, replicated on an independent tick feed, vanished outright. Its suspicious 98% buy-side skew was the bid-quote trap in person
- The rejected gap-and-go: the independent feed reproduced in-sample +0.12 ATR (direction confirmed) and out-of-sample -0.13 ATR (death confirmed). The rejection is the market’s truth
- The limit-order rescue of the Friday flow: could resting orders beat the cost wall? Measured fill rate: 72%, and the 28% that never fill are precisely the winners that ran away. Adverse selection eats the improvement; the trade stays underwater per attempt. Closed
And the round’s treasure, the measured Monday-open spread:
| Symbol | Monday open +15min (median) | +60min |
|---|---|---|
| GBPNZD | 17.2 pips | 10.8 pips |
| CHFJPY | 11.5 pips | 4.9 pips |
| EURNZD | 10.1 pips | 6.2 pips |
The first Monday hour is structurally closed to any signal worth less than 15 pips. Against this yardstick, a batch of “first 15 minutes of the week” candidate hypotheses measured below cost before registration and were discarded without consuming a hypothesis slot or an OOS seal, itself a benefit of the method. And the one survivor of the family, the weekend-gap fade (15-plus pips, one-hour wait), threads exactly this needle.
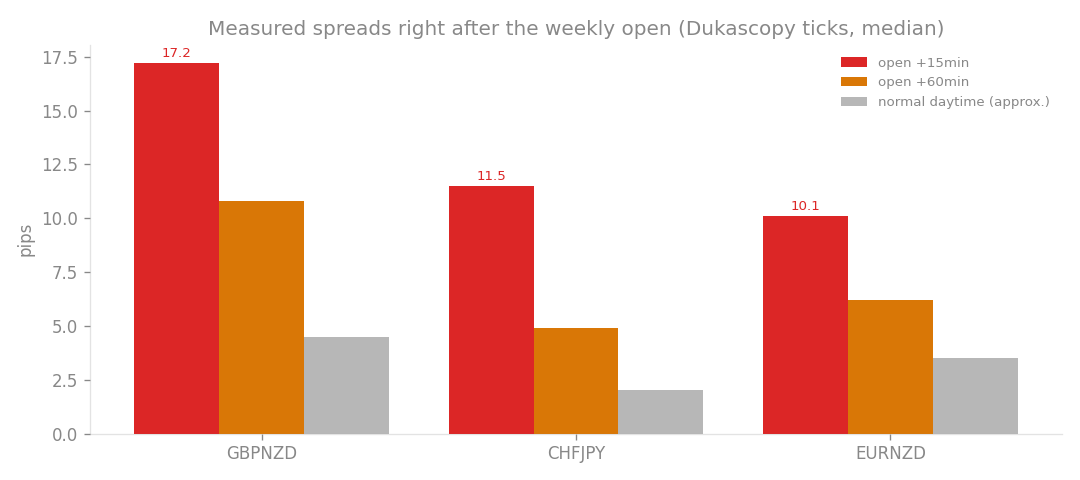
Round three’s key artifact: spreads in the first 15 minutes (red) run several times normal (grey), drowning any signal under 15 pips.
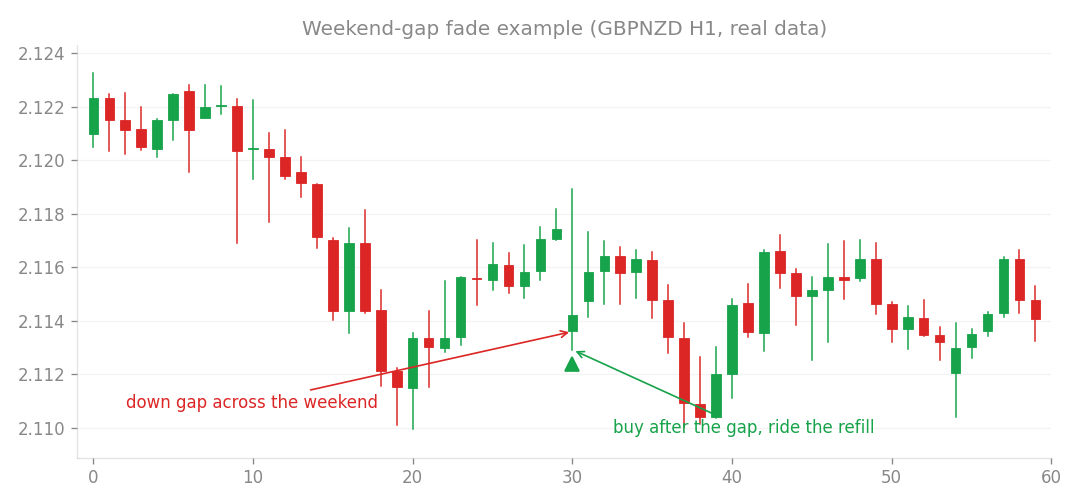
The one survivor threading that needle: wait an hour after the open, then trade the refill.
Settling the 0-14 account
| Round | Hypotheses | Survivors | What it bought |
|---|---|---|---|
| 1 | 9 | 0 | The 0.195 ATR cost wall, the accumulation-time law, two anti-trap controls |
| 2 | 3 | 0 | First live firing of the OOS discipline |
| 3 | 2 (+3 verdicts) | 0 | Three ghosts closed, the Monday cost table |
“Fourteen losses sounds like wasted time” is a fair reaction. But compare what remains afterward. Undisciplined exploration leaves nothing behind a loss except “maybe I searched wrong”. These losses converted into assets: wall coordinates, a law of boundary liquidity, a field guide to traps, a measured spread table, all of which raise the efficiency of every future search.
And above all: immediately after these rounds, the same framework pointed at the stock market produced the Monday crash buyer, which passed every pre-registered gate and became the program’s first true survivor (told in its own article). Only a machine that counts its losses honestly earns the right to call a winner a winner. Zero for fourteen was the tuition.