
The gold strategy that won on every setting, then dropped 7.2% in a single day
The life story of my gold trend sleeve in three studies: a Donchian breakout that stayed profitable across every parameter, a 1-minute intraday stress test that exposed a 7.2% daily equity drop, and the two-entry experiment that ended with one better entry instead.
A strategy that made money on every single parameter setting nearly lost 7.2% of the account in one day. The culprit was not a failed stop loss. It was the open profit the strategy had spent months accumulating. This article traces the family history of the gold trend strategy inside my EA: how it was born, how a 1-minute stress test exposed its structural weakness, and how a two-entry experiment ended up choosing its final form. Three studies (16, 17 and 50 in my research log), one story.
First time here? What you need to know
For new readers: this blog is a verification diary. I (one person) build my own automated FX trading program (an EA), statistically test trading methods, and publish the results, wins and losses alike. “Study N” refers to my numbered research log.
A few terms up front. PF (profit factor) is gross profit divided by gross loss, above 1 means profitable. DD (drawdown) is the decline from an equity peak. OOS (out-of-sample) is data the strategy never saw during optimization. A prop firm is a trader evaluation that funds you if you pass, with rules like “lose more than 5% of the account in one day and you fail”. MC (Monte Carlo pass rate) estimates the probability of passing those rules by resampling daily returns. A sleeve is one component strategy inside a larger system.
Birth: profitable from setting 10 all the way to 70 (study 16)
It started with a classic: a Donchian channel breakout on gold (XAUUSD). Buy when price breaks above the highest high of the last N bars, and ride the trend.
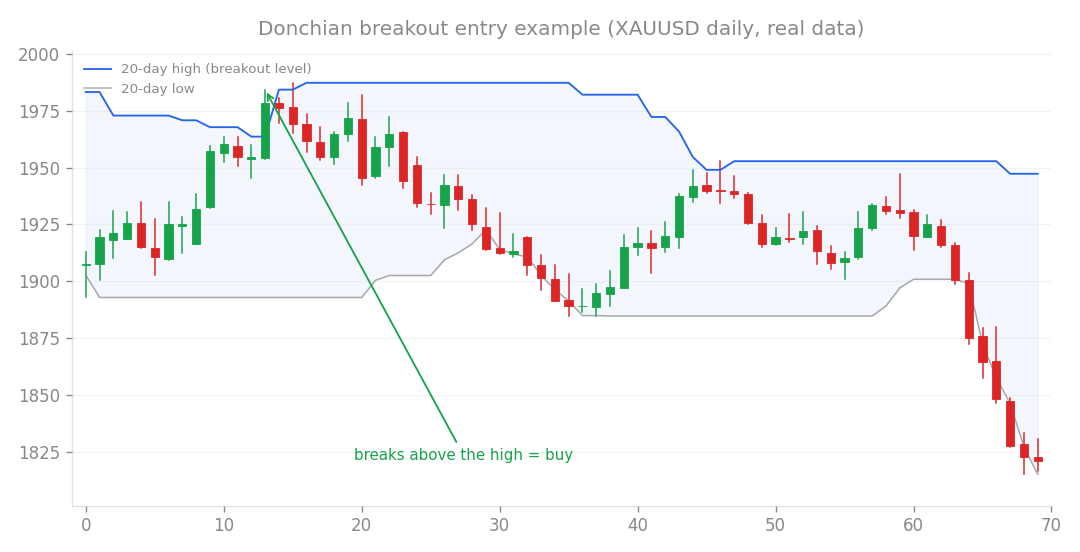
Breakout entry example (XAUUSD daily, real data): buy when price breaks above the recent high.
My first suspicion was curve fitting, a strategy tuned so tightly to past data that it predicts nothing. A method that only works at one magic parameter is usually a fluke. So I swept the entry lookback (entry_n) from 10 to 70. Every value was profitable, with PF ranging from 1.13 to 3.29 and the longer settings (40 to 55) doing best. When a strategy stays in the black no matter where you cut it, that is strong evidence it is capturing real market behavior, not memorizing history.
Next came the walk-forward test: pick the rules on past data, then grade them on data the rules have never seen.
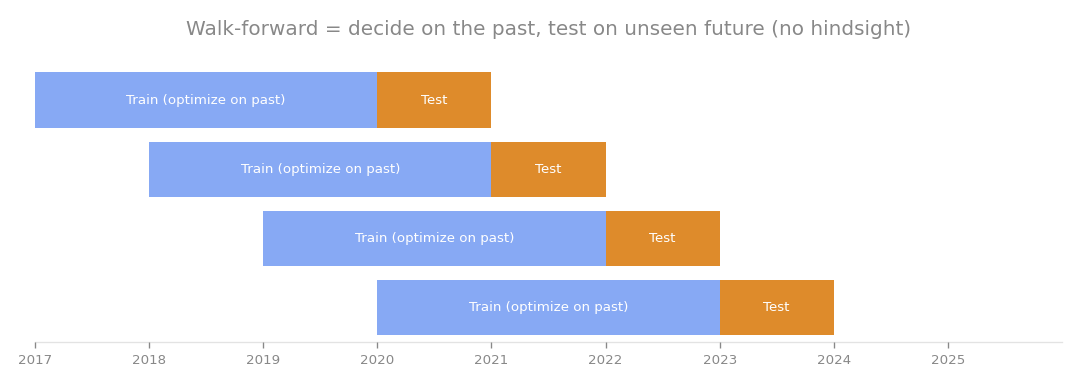
Walk-forward testing. It exists to stop you from grading your own homework.
| Metric | Measured |
|---|---|
| Walk-forward total return | +11.4% |
| Winning years | 6 of 8 |
| Worst year | -2.6% |
| OOS return | +6.6% |
| OOS max drawdown | -8.3% |
| OOS PF | 1.32 |
| MC pass rate | Step 1 43.8% / overall 24.5% |
This was the first strategy in my log to satisfy all three of my criteria at once: statistical consistency, a fundamental reason to exist (gold is a classic trending market), and parameter robustness. Three pieces of homework remained, though. The maximum drawdown of 8 to 12% sat uncomfortably close to the 10% prop limit. The intraday risk on 1-minute bars was still unverified, a real concern in a market as volatile as gold. And everything rode on a single market.
Diving to the 1-minute bars, and finding a 7.2% day (study 17)
Homework item two came due. A daily-bar backtest cannot see how deep the account sank within a day, and prop rules are checked intraday. So I rebuilt the account’s equity curve from 1-minute (M1) bars and searched for days that would have breached the daily loss rule.
One did. On January 30, 2026, the simulation showed a daily equity drop of -7.2% at 1% risk per trade. Cutting risk to 0.7% still produced -5.3%. Both breach the 5% daily limit.
I went in expecting a bug. What I found was the market. A long position opened on September 1, 2025 at $3445 had been running for months with a large open profit. On January 30, 2026, gold collapsed intraday from an open of $5382 to a low of $4678, a 14.3% range in a single session. The accumulated open profit evaporated, and account equity (which includes unrealized gains) fell 7.7% from the day’s open.
Here is the uncomfortable part: the trade itself was still deeply profitable overall. But the daily rule counts equity, so giving back open profit counts as a loss. You can fail the evaluation in the middle of a winning trade. The core tension was now visible in hard numbers: trend following exists to let winners run, and the daily loss rule exists to punish exactly the equity swings that big winners produce.
So how do you defend against that? The plan coming out of this study was to add trailing stops (raising the stop as open profit grows) or partial profit taking, then rerun the M1 verification. One more flag went up as well: gold above $5000 moving 14% in a day looked suspicious as data, so a health check of the price series itself joined the homework list. That flag later grew into a full audit of my data, a story of its own.
Adding a second entry made it weaker (study 50)
That left the concentration problem, and a related idea: what if gold ran two entry styles instead of one? Alongside the existing breakout entry, I tested an ATR-based long entry (ATR measures recent volatility, and this entry triggers on volatility expansion). My engine allows only one position per symbol, so the correct way to test this was to run the two strategies as separate books and merge the account results afterward. The test used XAUUSD 4-hour bars on clean data from 2015 to 2024.
| Setup | Return/DD ratio | Total return | Max DD | Sharpe | PF |
|---|---|---|---|---|---|
| A alone (ATR entry) | 5.41 | +60.5% | -11.2% | 0.90 | 1.44 |
| A+B combined | 4.86 | - | - | - | - |
| B alone (breakout) | 2.59 | - | - | - | - |
The hope was that two entries would smooth the ride. The measurement said otherwise: A alone beat the combination. Two reasons. First, the daily correlation between the two books was 0.64, which is high, and no surprise, since both buy the same metal in the same direction. In earlier studies, diversification only paid off when correlations sat near 0.00. Second, mixing a weaker strategy into a stronger one drags the blend toward the weak leg. The combined drawdown of -15.9% was slightly better than the -17.6% sum of the two standalone drawdowns, but that sliver of benefit did not justify the added complexity.
Was the experiment wasted, then? Quite the opposite. Its real yield was the discovery that the ATR entry is clearly superior to the breakout entry, 5.41 versus 2.59 on return over drawdown. The conclusion was not “bundle them” but “replace the gold entry with the ATR version”. As a reference point, a prop-style evaluation running each entry at risk 0.003 (0.3% of capital per trade) returned +43.4% with a -9.9% drawdown, passed Step 1, and kept the worst single-day loss at 1.66%. That number is not directly comparable to study 17’s -7.2%, since the risk setting is much smaller, but between tighter sizing and a better entry, the strategy had moved far away from the daily-loss cliff.
What the family history taught me
- Measure robustness as “does it win on every setting”. The all-positive parameter sweep from study 16 became my standard test for telling real edges from lucky ones
- Backtest resolution matters. A failure invisible on daily bars is obvious on 1-minute bars. Open profit is equity, and giving it back counts as losing it
- A failed diversification is still progress. The losing experiment is what identified the best single entry
From birth to final form, there is not one dramatic discovery in this story. Just the same loop three times: doubt the strategy you built, measure it at higher resolution, and let a comparison pick the survivor. That unglamorous loop is what separates a lucky candidate from a core holding.
This article consolidates studies 16, 17 and 50.