
A 75.5% win rate that lost 26%: every exit and take-profit fix I tested failed
Four studies on improving the exits of a trend-following EA. Take-profit targets, a chandelier trailing stop, wider and tighter exit windows, and averaging down all made results worse, and the win-rate trap explains why the account shrank as the win rate soared.
There is a one-parameter change that lifts my trading system’s win rate from 36.8% to 75.5%. It also turns ten years of +122% into a 26% loss.
That is not a typo, and it is the thread running through this article. I spent four separate studies trying to improve the exits of my trend-following EA (automated trading program): a take-profit target, a smarter trailing stop, a wider exit window, and averaging down into losers. Every single attempt made things worse, and all four failed for the same reason. This is the story of that reason, the win-rate trap.
First time here? What you need to know
For new readers: this blog is a verification diary. I (one person) build my own automated FX trading program, statistically test trading ideas, and publish everything, wins and losses alike. “Study N” refers to my numbered research log; this article consolidates four entries into one narrative.
The system under the knife is a trend-following breakout. It buys when price breaks above a recent high, sets no profit target at all, and holds until price closes below the low of the last 25 bars. That “exit on a break of the recent low” rule is called a channel exit. In plain words: stay in as long as the trend keeps making higher ground, leave when it cracks.
Three terms before we start. PF (profit factor) is gross profit divided by gross loss, above 1 means profitable. DD (drawdown) is the peak-to-trough decline of the account, like asking a mountain climber how far below the summit they have slipped. ATR measures recent volatility, so distances like stops and targets scale with how wild the market currently is.
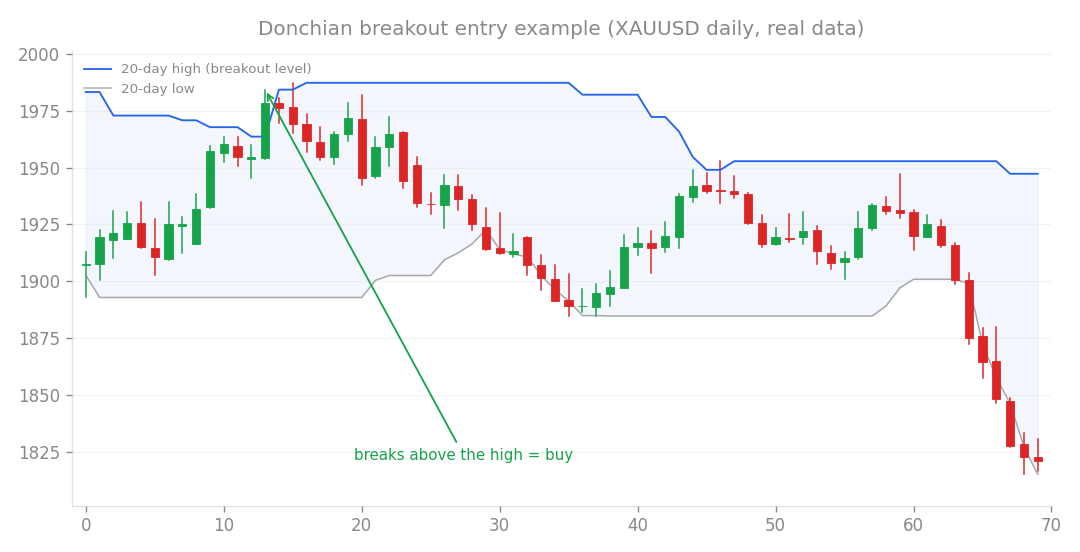
The system in question: buy the breakout, hold until the channel low breaks. All four studies attack the exit side of this picture.
Where trend following actually earns its money
One piece of background carries all four verdicts, so let me spoil it now. Trend-following profits are concentrated in a handful of rare, huge winners, the region statisticians call the fat tail of the distribution.
A strategy of this type accepts many small losses and pays for them all with the few trades a year that catch a monster trend from start to finish. A low win rate is not a defect. It is the design. Keep that in mind as the four experiments unfold.
Study 121: the closer the take-profit, the worse everything else
The most direct experiment first. Starting from the current setup (no take-profit, channel exit only), I added a fixed take-profit target at 1 to 12 times ATR and ran the comparison on real data from 2015 to 2024. The two ends of the sweep:
| Setting | Win rate | PF | Total return | Max DD | Trades |
|---|---|---|---|---|---|
| TP = 1 ATR | 75.5% | 0.94 | -26% | -41.5% | 4,791 |
| No TP (current) | 36.8% | 1.31 | +122% | -21.4% | 1,166 |
The result was perfectly monotonic. The closer the target, the higher the win rate, and the worse the PF, the return, and the drawdown. There is no sweet spot in the middle. No take-profit at all wins on every metric except the win rate.
How a 75.5% win rate loses money
Look at the TP = 1 ATR row again. Three trades out of four are winners, yet PF sits at 0.94, a net losing system, with the drawdown deepening to -41.5%. So what got lost while the win rate was going up?
The breadwinners. A tight target harvests every trade at +1 ATR, including the few that would have grown into the year’s giant winners. The count of small wins goes up, the size of the losses stays the same, and the pillar holding up the whole account quietly disappears. On top of that, closing early recycles the system into new trades, so the trade count balloons from 1,166 to 4,791, roughly four times the transaction costs and four times the exposure to false signals.
The win rate is an excellent measure of how good trading feels. As a measure of whether you are making money, it can point in exactly the wrong direction. That is the win-rate trap.
Study 57: a smarter trailing stop that only worked in one regime
If a fixed target fails, maybe a more intelligent exit succeeds. Next I replaced the channel exit itself with a chandelier exit, a trailing stop that follows price at a multiple of ATR. The test ran on the four FX pairs my core system trades, on the 1-hour timeframe, over the full history.
At first glance it looked like a win. Measured by return over max drawdown (r/DD), the chandelier at 6 ATR scored 6.74 against 5.72 for the default channel exit. Had I adopted it there, this would have been a success story.
But the details smelled wrong. Dropping the multiple to 3 or 4 ATR made performance worse, and on the 4-hour timeframe the celebrated 6 ATR setting fell to the bottom of the group. That kind of sensitivity to parameters and timeframes is the classic symptom of a fragile setting.
Splitting the data by period settled it. The chandelier 6 ATR only outperformed during 2021 to 2025, the stretch of powerful one-way trends in the yen and in gold. From 2015 to 2021, the plain channel exit was better. The full-period advantage was nothing but a good fit to the most recent regime, a textbook case of over-optimization (tuning a system to one period’s quirks until it fails everywhere else). Not adopted.
Study 122: loosening the exit fails too, the current setting is the peak
Pulling the exit closer was monotonically bad. What about the opposite direction, giving trades even more room by widening the channel? I swept the exit window exit_n from 15 to 100 bars.
| exit_n | PF | Total return | Max DD |
|---|---|---|---|
| 15 | 1.14 | -31.8% | |
| 25 (current) | 1.31 | +122% | -21.4% |
| 100 | 1.26 | +73% | -32.6% |
This time the curve is not monotonic but a clean inverted U. A narrow 15 rushes the exit and suffers. A wide 100 keeps holding long after the trend has reversed, hands back the open profit, and lands at +73% with a -32.6% drawdown. The current 25 sits exactly at the crest between two opposing needs, letting profits run and escaping before they melt.
For completeness, the chandelier 6 ATR from study 57 also entered this comparison. It edged ahead on PF 1.37 and +125% total return, but its drawdown widened to -28.6%, losing on efficiency. The same verdict as before: the channel exit is the robust one.
Study 125: averaging down hides losses, then doubles them
The last experiment is a cousin of the exit question, averaging down. Every time the open loss grows by a set multiple of ATR, buy more to lower the average entry price and wait for the bounce. It is the “never book a small loss” school of exit management. I compared zero to three add-ons.
| Max add-ons | PF | Total return | Max DD | Days losing over 5% (M1) |
|---|---|---|---|---|
| 0 (none) | 1.22 | +41% | -13.2% | 1 day |
| 1 | 1.18 | +36% | -18.5% | 2 days |
| 2 | 1.14 | +32% | -22.1% | 2 days |
| 3 | 1.11 | +28% | -26.9% | 3 days |
The right-hand column comes from rebuilding the intraday account curve from 1-minute bars and counting days where the account lost more than 5%. Under prop-firm rules (firms that let you trade their capital once you pass an evaluation), a single day like that means instant disqualification.
Every added layer made things monotonically worse. The max drawdown nearly doubled from -13.2% to -26.9%, and the instant-disqualification days grew from one to three.
The illusion works like this. Because small losses are no longer being realized, the day-to-day results look smooth, almost like a higher win rate. But the losses have not disappeared. They are accumulating into one catastrophic hit for the day the market keeps going against you. Averaging down trades many small, manageable losses for a rare, devastating one, the same structure as a martingale (doubling the stake after every loss). It is the win-rate trap in its most dangerous costume. Rejected, of course.
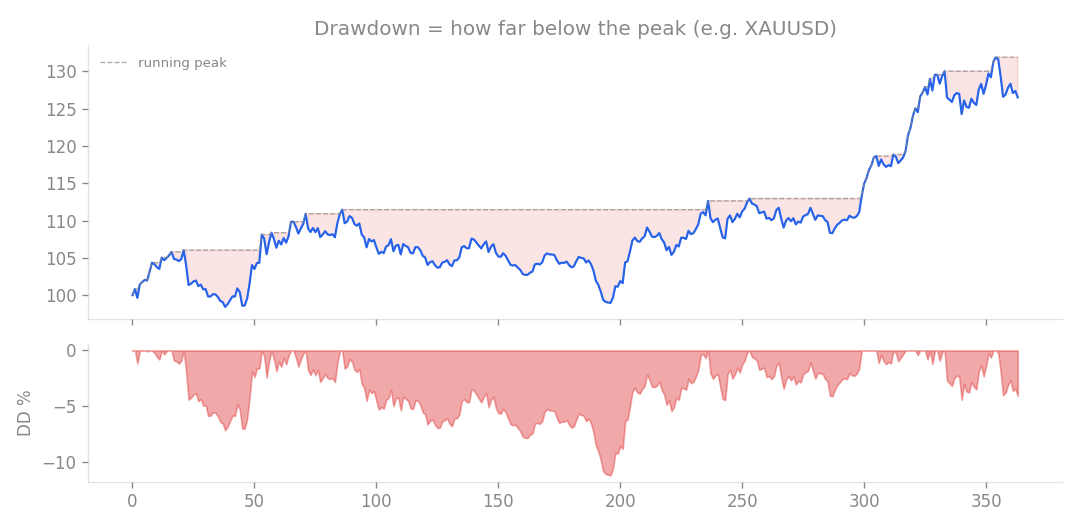
Drawdown is the slide from the equity peak. Averaging down smoothed the daily picture and, in exchange, dug this valley nearly twice as deep.
The verdict of the lineage: profits live in the tail, early exits harvest it
Line the four studies up and one conclusion emerges.
- A take-profit target raises the win rate and shrinks the account (study 121)
- A cleverer trailing stop was a bet on the most recent regime (study 57)
- The exit window sits on an inverted U and the current 25 is its peak (study 122)
- Hiding losses with add-ons returns them with interest (study 125)
The engine of a trend follower is the fat tail, the few winners that keep running as far as the market will carry them. Every exit modification I tried, even the defensively minded ones, ended up cutting into that engine. And the cruel part is what you get in exchange: a higher win rate, the single most pleasant number in trading. To the person doing the tinkering, the broken system genuinely looks improved.
So the takeaway is simple. When judging a strategy or a modification, do not start from the win rate. Read PF, return, and drawdown first, and treat the win rate as a personality trait, not a verdict. Whenever a change sends the win rate soaring, ask what happened to the tail. After these four studies, my EA runs with its exits exactly as they were.
This article consolidates studies 57, 121, 122 and 125.