Ten engines that translate chart-reading talk into testable numbers
How I built the quantification layer of my backtesting framework across two studies: volume profile, pivots and Fibonacci as three pillars of objective support and resistance, then a ten-pattern candlestick engine and chart-pattern detection, all verified free of lookahead bias.
“Buy the bounce off support.” “An engulfing candle means reversal.” Discretionary trading is taught in sentences like these, and as long as they stay sentences, you can never find out whether they actually make money. So across two rounds of work (studies 77 and 80 in my research log), I built a set of ten engines that translate that language into numbers a backtest can judge. This article is not about a win or a loss. It is about building the courtroom.
First time here? What you need to know
For new readers: this blog is a verification diary. I (one person) build my own automated FX trading program (an EA), statistically test trading methods, and publish the results, wins and losses alike. “Study N” refers to my numbered research notes.
Three terms for this article. S/R (support and resistance) means price levels where the market tends to bounce. Walk-forward testing means choosing your rules on past data, then checking whether they still work on newer data that played no part in the choice. And lookahead bias (a “leak”) means information from the future sneaking into a calculation that pretends to run in the past. It is the single most dangerous bug in any testing framework, because it makes losing strategies look like winners.
Why build tools before strategies
If you only test the ideas that happen to occur to you, the doubt about everything untested never goes away. The alternative is to quantify every element on the chart first, so that whenever a new hypothesis shows up, the test can start immediately instead of waiting weeks for new code. At this point in the project I deliberately shifted effort from proving theories to thickening the toolbox.
I surveyed trading methods on the web, listed everything that was quantifiable but not yet implemented in my library, and worked down the list.
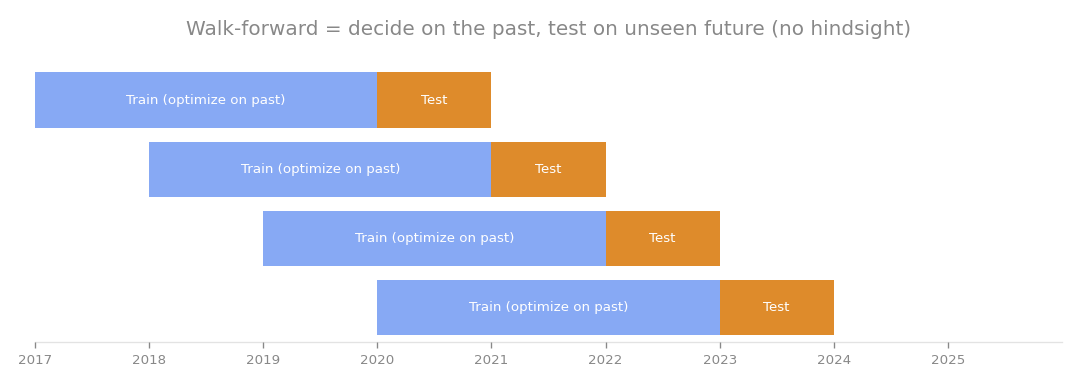
Every strategy assembled from this toolbox gets judged by walk-forward testing. If the tools themselves leak future information, that judgment is worthless, which is why leak-freedom came first.
Study 77: three pillars of objective support and resistance
The first round added three engines that draw lines mechanically.
| Engine | What it turns into numbers |
|---|---|
| Volume profile | The distribution of trading volume across price levels, marking where activity concentrated |
| Pivot points | Levels computed by formula from the previous day’s or week’s prices, in the Classic, Fibonacci and Camarilla variants |
| Fibonacci | Retracement levels projected automatically from confirmed swing points |
I call these objective because there is no room for opinion about where the line goes. Feed in the same data and everyone gets the same levels.
Volume profile needed one sanity check first. FX has no true traded volume the way stocks do, only tick volume, the count of price updates. Measured on my data, that comes to roughly 6,000 ticks per hourly bar on average, which is plenty for a meaningful distribution. As insurance for any environment where volume reads zero, the engine falls back automatically to a time-at-price (TPO) method that measures how long price lingered at each level instead.
Together with the existing engines for horizontal levels, trend channels and Dow structure, this gave me three pillars of objective S/R. A discretionary filter like “only buy near a level that matters” can now be written as a numeric condition instead of an eyeball judgment.
Study 80: every candlestick pattern in the book
The second round tackled candlesticks and chart patterns. I restricted this work to FX price data, based on the judgment at the time that stock indices do not reliably meet the pass requirements of prop firms (companies that let traders run the firm’s capital instead of their own), which are the target of this project.
The candlestick engine detects ten classic patterns, including the doji, hammer, shooting star, marubozu, engulfing, harami and the morning and evening stars, and assigns each bar a bull score and a bear score. “A strong bullish reversal candle appeared” becomes a number.
The chart-pattern engine detects double tops, double bottoms and head-and-shoulders formations from confirmed price swings, and fires its signal only when the neckline actually breaks. No fuzzy “the pattern is forming” states, only completed events.
Leak-freedom got special attention here, because pattern detection is exactly where lookahead bias loves to hide. It is very easy to write code that waits for a future swing to confirm and then quietly plants the signal in the past. Every engine in the set has been mechanically verified to use only information available at the moment of each bar. Break that guarantee once and the whole toolbox becomes untrustworthy.
My expectations are low on purpose
Having built all this, do I expect candlestick patterns to be profitable on their own? No. The studies leading up to this point (73 through 79) had already shown a consistent picture: of all the filters laid over my FX trend-following framework, only swing levels, the horizontal lines the market demonstrably respects, produced an edge. Everything else came out mediocre or negative. I expected the pattern engines to land in the same place.
So why build them at all? Two reasons. First, speed: when a hypothesis arrives, the test should start the same day, not after weeks of engine-writing. Second, closure: “untested” is a worse state than “tested and dead”. If these patterns lose, I want the loss confirmed in numbers, not suspected forever.
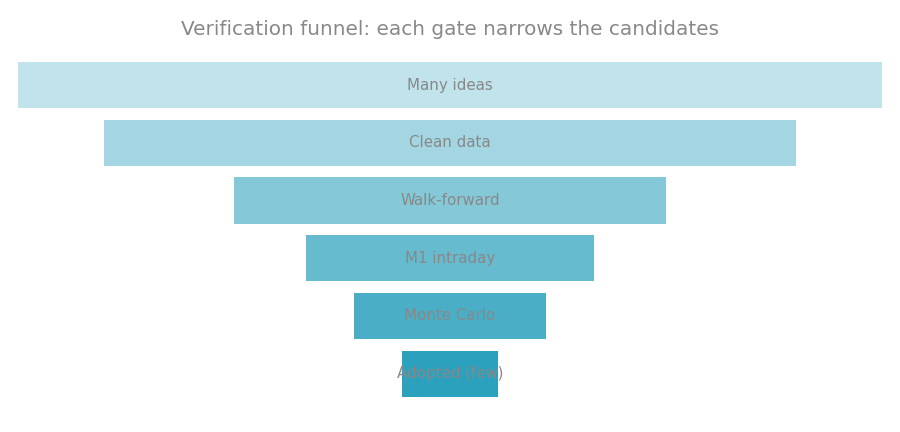
The exit of the toolbox is this funnel. Once discretionary language has been translated, it gets judged here without mercy.
The finished shelf, and what remains on it
After the two rounds, the quantification layer counts ten engines: the standard indicator suite (SMA, RSI, ATR and friends), horizontal level importance, diagonal channels, Dow structure, volume profile, pivots, Fibonacci, candlestick patterns, chart patterns, and multi-timeframe regime detection.
One item remains on the backlog: harmonic patterns such as the Gartley, Bat and Butterfly, shapes defined by Fibonacci ratios between swing points.
The toolbox itself earns nothing. What these two studies bought is something quieter: nearly any discretionary trading idea can now be dropped into a rigorous, leak-free walk-forward test as-is. “Bounce off support” and “engulfing means reversal” finally have a courtroom, and losses can be settled as losses, in numbers.
This article consolidates studies 77 and 80.