Measuring 'it comes down to discretion' to death: 88 conditions and an AI eye
The escape hatch of every strategy video, 'discretion', put under measurement: 88 verbalizable conditions, cross-market regime calls, the entire multi-timeframe combination space, machine learning, and state-of-the-art vision AI. Seven studies, one verdict, and the question that honestly remains.
Every strategy video has the same closing line: “in the end, it comes down to discretion”. Show mechanically that the rules lose, and this one sentence resets the whole debate. Discretion cannot be put into words, therefore cannot be measured, therefore cannot be refuted. So the story goes.
Does it hold? I decided discretion becomes measurable the moment you redefine it as information: the ability to select better-than-average trades out of a candidate stream. Then I measured every route that information could travel: 88 verbalizable conditions, cross-market context, the entire multi-timeframe combination space, machine learning, state-of-the-art vision AI, and my own blind-test performance.
The verdict, stated up front: zero selection information on every route. This article binds seven studies (research notes 222, 225, 239, 240, 241, 242 and its follow-up) into one long report.
First time here?
One paragraph of context for new readers. This blog is a verification diary: I (one person) build my own automated FX trading program (an EA) and statistically test both public methods and my own ideas, publishing wins and losses alike. “Study N” refers to my numbered research log; this article stands alone. The data behind it: about 11 years of real prices across 18 FX pairs, gold, silver and indices, plus 21 years of daily bars on 283 US stocks.
Setup: a ruler for discretion
First, the measuring stick. Call the performance of a method’s mechanical core, taking every candidate with no human filter, the “floor”. Call the performance of an oracle who knows the future and picks freely from the same candidates the “ceiling”. The value of discretion is how far up from the floor toward the ceiling a selector can climb.
That climb compresses into one number, kappa: 0 means selection indistinguishable from chance, 1 means oracle-grade. Working backwards from a target performance (say PF 1.3) gives kappa-star, the required skill. The beauty of this framing: “I can win with discretion” becomes the falsifiable claim “my kappa exceeds kappa-star”.
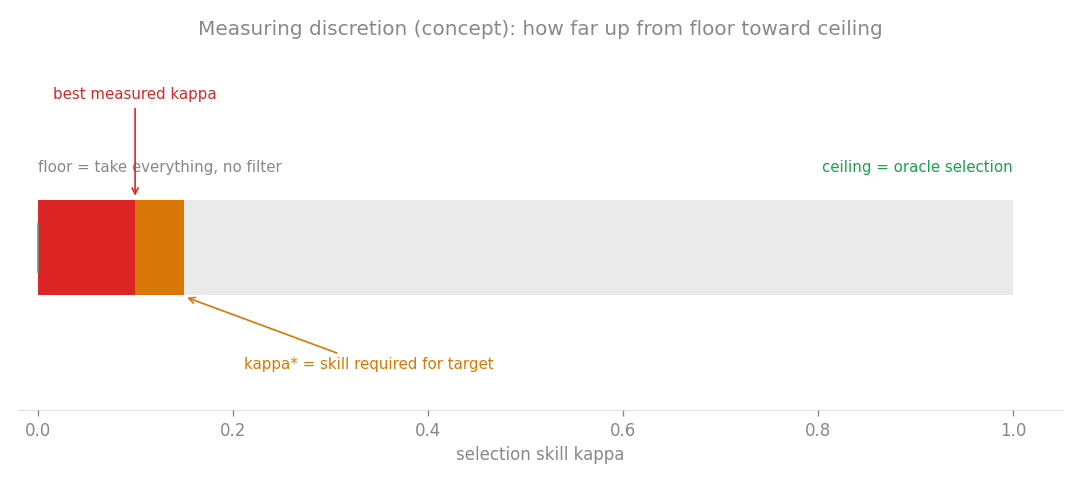
The article’s yardstick. Red is the best measured kappa (0.10); the orange edge is kappa-star at 0.15. Every measurement below is a contest over whether the red bar can reach the orange.
Route 1: eyes on other markets (study 222)
The first route is context from elsewhere: stand down FX mean reversion when US stocks are stormy, ride trends only when gold is strong. Eight cross-market regime conditions, applied as labels to every trade of the trend core and the mean-reversion sleeve.
The result was a two-part punchline. Part one: two statistically genuine relationships exist. Mean reversion improves to PF 1.70 in equity risk-on and PF 1.96 in calm regimes, and melts to PF 0.63 in risk-off. Mean reversion really is a fair-weather strategy.
Part two: both relationships are the exact interactions my two deployed guards (the equity-shock guard and the equity filter) already exploit. A rediscovery, not a discovery. And the effect size, kappa around 0.05, sits at one fifth of the practical bar of 0.25; with 781 trades, even trivia turns significant. The distance between statistically significant and usable, felt firsthand.
Route 2: the last sixteen nameable conditions (study 240)
Seventy-two discretionary concepts had been mechanized in earlier work. Cross-checking the logs for genuinely unmeasured ones left sixteen, and remarkably, they included the king of discretionary tools: RSI divergence (everyone, including me, had assumed it was measured long ago). Alongside it: Fibonacci pullback depth (38.2 to 61.8 percent), sloped-line proximity, trend youth, third-wave structure, round numbers, moderate volatility, “clean charts”, session windows, and three composites like divergence-at-a-level.
Two fronts. As entry conditions, 2,769 tests: the eleven apparent survivors were all one group, New York session H4 shorts, whose entire effect sat in the 22:00 bar. The midnight bid-sinking artifact, appearance number four. True survivors: zero.
As selection filters: nothing rescued the losing skeleton (the MTF pullback below, floor PF 0.879); even RSI divergence lifted it only to PF 0.97, still underwater. On the winning skeleton (Connors mean reversion, floor PF 1.45), every condition merely cut frequency and lowered monthly returns. Connors mean reversion is a rule running live in my EA: buy the dip when price sits above the 200-day average and RSI(2) drops below 10.
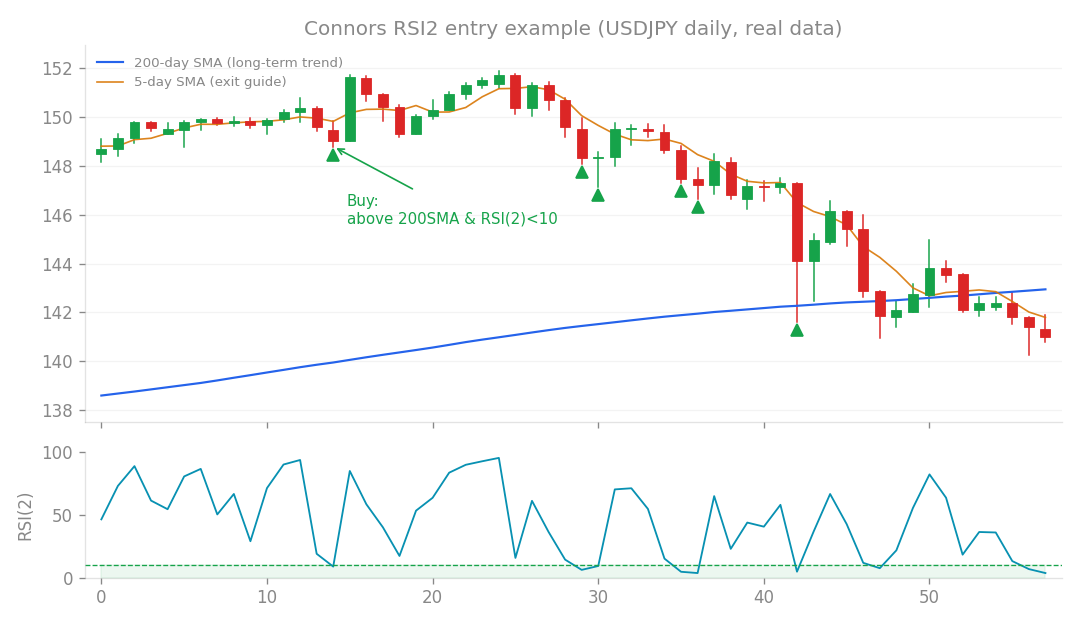
The winning skeleton in action. Stacking discretionary filters on an already-working rule only starved it of trades. Running total: 88 verbalizable concepts, zero carrying selection information.
Route 3: the entire MTF space (studies 239, 242 and follow-up)
“Environment on the higher timeframe, timing on the lower.” The backbone of nearly every tutorial. Individual incarnations had been tested before (including one advertising an 80% win rate), but never the entire configuration space.
So: five timeframe pairs (daily to H4, H4 to H1, H1 to M15 and so on), 20 FX and metal symbols, four higher-timeframe contexts (Dow structure, perfect order, the 200-day line, strong trend), six lower-timeframe triggers (EMA recross, RSI bounce, reversal candle, momentum bar, breakout, squeeze release), with-trend and counter-trend, two horizons, midnight hours excluded at scan time.
18,219 tests. Zero survivors of the first FDR gate. The near-misses were below cost or signed against the textbook.
Anticipating the objection that stocks, where momentum supposedly persists, would differ, the scan moved there too: 283 stocks, weekly context times daily trigger, 10,911 tests, with forward returns de-meaned per symbol and period so that only excess over buy-and-hold counts. Zero. The monthly-context variant added 8,554 tests: zero, with in-sample leaders sign-flipping out of sample (one name swung from -506bp to +147bp). Stock-specific noise.
This route’s real yield was pricing the discretion defense. The textbook MTF pullback’s floor is PF 0.879 (monthly -4.89%), a losing skeleton, yet with 100-plus candidates a month the oracle reaches PF 97. High ceiling. The game is pure kappa: PF 1.3 needs kappa-star 0.15, the tutorial-favorite 70% win rate needs 0.45 to 0.60. Measured kappa of everything nameable: at most 0.10, never significant. “MTF works once you add discretion” has been converted into a conditional: “if something exists that clears the 0.15 wall”.
Route 4: intuition beyond words (studies 225, 241)
With verbal discretion exhausted, one defense remains: “I cannot explain it, but I see it in the chart.”
First, a machine-learning proxy. Raw 30-day price windows, the shape itself, fed to LightGBM to predict 5-day returns, under strict time-series splits with 40 block-shuffled null controls that preserve autocorrelation. Out-of-sample predictive power: IC +0.0030 against a null 95th percentile of +0.0242, p=0.35. A mock long-short on its rankings: PF 1.021, +0.05% monthly. The ironic detail: a model fed verbalized indicators did worse (-0.0168), textbook overfitting.
Tabular learners might still miss what eyes catch, so actual eyes came next. Two state-of-the-art vision models each judged 400 anonymized chart images (symbol and date hidden, nothing beyond the decision point), answering take or pass with confidence, scored by the same kappa machinery used for humans.
| Model | Accept rate | PF on accepts | kappa | 95% CI upper |
|---|---|---|---|---|
| Fast model | 36% | 0.76 (below the 0.89 floor) | 0.00 | 0.04 |
| Stronger model | 39% | 1.00 (a coin flip) | 0.00 | 0.09 |
High-confidence picks only? No better (PF 0.79 for the fast model). The stronger model teased kappa 0.04 at the 200-question checkpoint and regressed to zero by 400. Noise.
The crucial point: this is stronger than non-significance. Against the required kappa-star of 0.15, both models’ confidence intervals cap out below it (0.04 and 0.09). The hypothesis that rescuing visual information exists gets rejected on effect-size bounds. My own blind test, run before all this, had already lost to the floor.
The scoreboard
| Route | Scale | Result |
|---|---|---|
| Nameable conditions | 88 concepts | zero selection information |
| Cross-market context | 8 gates | rediscovered existing guards, kappa 0.05 |
| MTF context (FX, metals) | 18,219 tests | zero survivors |
| MTF context (stocks, weekly and monthly) | 19,465 tests | zero survivors |
| Machine learning (shape proxy) | 30-day GBT | indistinguishable from noise |
| Vision AI | 2 models, 400 questions each | kappa 0.00, CI below kappa-star |
| Human (me) | blind test | lost to the floor |
So when someone says a failing method would work with discretion added, this data now answers in numbers: whatever was supposed to be added never showed up in any net we cast.
The question that honestly remains
To be precise about the claim: this is not “all discretionary traders are lying”. The measurements cover information visible in daily-to-15-minute OHLCV of FX, metals and stocks. Order books, news interpretation, faster timescales sit outside the net. And the vision-AI verdict describes today’s models; when stronger ones ship, the rig re-runs for a few dollars.
But this much stands: of everything that courses and videos call discretion, the parts explained in words are measurable, and they all measured zero. If true discretionary masters exist, what they carry is something unnameable, something above kappa 0.15. The rig is preserved in working order, waiting for that challenger.