Core System v1.5.0 Unleashed: New Strategy Promises Explosive Gains!
Building a robust Expert Advisor (EA) for FX trading is a journey, not a sprint. We've been tirelessly refining our "Core System" to not only generate
A beginner-friendly summary of the verification: “Core System v1.5.0 Unleashed: New Strategy Promises Explosive Gains!”.
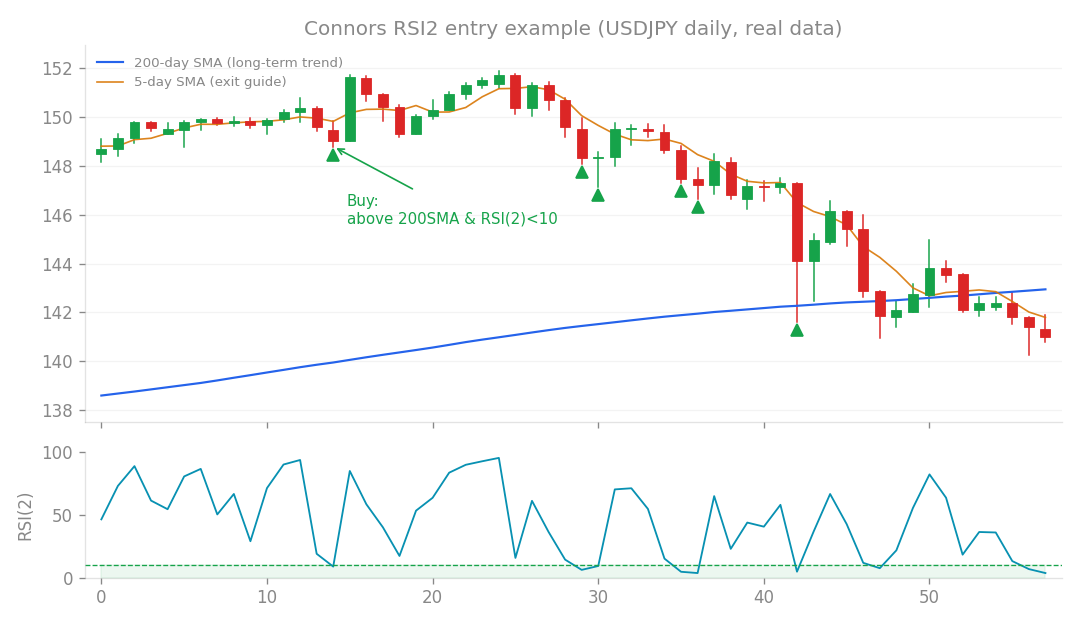
Connors RSI2 entry example (USDJPY daily, real data): buy the dip when price is above the 200-day SMA and RSI(2) falls below 10.
Building a robust Expert Advisor (EA) for FX trading is a journey, not a sprint. We’ve been tirelessly refining our “Core System” to not only generate consistent profits but also to withstand the toughest market conditions and pass those stringent prop firm challenges. Today, I’m excited to share the latest milestone: Core System v1.5.0. This isn’t just a small tweak; it’s the culmination of extensive research and a significant leap forward. Let’s dive into how we got here and what makes v1.5.0 our most powerful version yet!
What’s the idea?
Our “Core System” is essentially an algorithmic trading strategy designed for FX and stock indices. The main goal is to generate stable, consistent returns while keeping drawdowns (DD – the maximum percentage your account balance drops from its peak) to a minimum. Think of it like building a diverse investment portfolio: you don’t put all your eggs in one basket. We started with a “trend core” – a strategy that aims to profit from sustained market movements. But relying on just one strategy can be risky. If the market conditions aren’t right for that core, your entire system suffers. That’s where “sleeves” come in. A sleeve is like adding a completely separate, independent mini-strategy to the main system. The magic happens when these sleeves are “uncorrelated” with the core strategy. In other words, they don’t tend to win or lose at the same time. If one is struggling, the other might be thriving, smoothing out your overall equity curve and significantly reducing your total drawdown. This has been our guiding principle throughout development: find positive expectancy sleeves that genuinely don’t correlate.
How I tested it
Developing an EA isn’t just about coding; it’s about rigorous testing to ensure it holds up in the real world. Here’s how we put the Core System through its paces:
- Extensive Backtesting: Running the strategy over many years of historical data to see how it would have performed.
- Monte Carlo (MC) Simulations: This is like stress-testing on steroids! Instead of just one historical run, we shuffle the order of trades thousands of times to see how the system performs under various “what if” scenarios. This tells us how robust the strategy is, providing a “pass rate” for different performance hurdles.
- M1 Intraday Verification: We dig into 1-minute chart data to ensure the system’s intra-day drawdown (how much it can dip within a single day) is safe and doesn’t trigger prop firm daily loss limits. This is crucial for real-world trading.
- In-Sample (IS) vs. Out-of-Sample (OOS) Testing: We develop and optimize the strategy on one set of data (IS) and then test it on completely fresh, unseen data (OOS). This helps confirm the strategy isn’t just “curve-fitted” to past data but can perform well in the future.
- Prop Firm Compliance: Many of our metrics (like maximum drawdown, daily loss limits, and even minimum trade holding times) are specifically designed to ensure the system can pass proprietary trading firm challenges.
What happened? The Core System’s Evolution
Let’s walk through the journey of the Core System, highlighting the key innovations that led us to v1.5.0.
v1.0.0: The Solid Foundation (The Core)
We started with a strong core: a trend-following strategy for four major FX pairs and Gold (using an ATR Candle Breakout entry, which proved much better than a simple breakout for Gold).
- Results: Around +0.47% monthly profit, with a maximum drawdown (DD) of -9.01%. The Profit Factor (PF = gross profit / gross loss; >1 means profitable) was 1.30, and it had 9 out of 11 winning years. Our Monte Carlo simulations showed an overall pass rate of 85%, and crucially, it passed M1 intraday checks with zero daily disqualifications.
- Takeaway: This version was a great starting point, optimized for passing prop firm challenges and survival. It showed that a disciplined trend-following approach could be stable. However, we hit a “price ceiling” of around 0.5% monthly profit with this single core.
v1.1.0: Breaking the First Ceiling (Adding the Index Sleeve)
This was a major breakthrough! We introduced a “stock index sleeve” for US500, US100, and US30. The genius here was that this index strategy was designed to be uncorrelated with our FX trend core (correlation was only around +0.16).
- Innovation: This was the first time we successfully added a genuinely uncorrelated profit source, pushing past that initial 0.5% monthly profit ceiling.
- Results: Monthly profit jumped to ~0.58% (a +23% increase!), DD remained controlled at -9.98%, and our overall Monte Carlo pass rate improved to 91%.
v1.2.0: Expanding the Arsenal (Satellite2 Sleeve)
Next, we added another independent strategy we called “satellite2,” inspired by user ideas around Dow theory and price levels.
- Results: Monthly profit climbed further to 0.68% (a +17% boost from v1.1.0), with improved winning years. The overall Monte Carlo pass rate reached 92%.
v1.3.0: The Game Changer (Volatility Targeting)
This was a pivotal moment! We implemented “volatility targeting” (vol_target). This brilliant mechanism automatically adjusts our position size based on market volatility: we reduce trade size during choppy, high-volatility periods and increase it during calmer times.
- Innovation: This approach asymmetrically reduced drawdown. It aggressively cut risk when the market was most dangerous, leading to a much smoother equity curve.
- Results: DD dropped significantly to -8.8%! Monthly profit rose to 0.71%, Profit Factor to 1.48, and the overall Monte Carlo pass rate hit 93%. All key metrics improved simultaneously.
v1.3.1: Refining Volatility Targeting
We extended the vol_target mechanism to our “satellite2” sleeve and increased its maximum scaling cap.
- Results: Monthly profit further improved to 0.79%, Profit Factor to 1.57, and Monte Carlo pass rate to 94.3%. Drawdown slightly increased to -9.5% but remained well within our target limits.
v1.4.0: Inter-Market Intelligence (Equity Risk-Off Filter)
This version introduced a truly smart risk management layer: using the stock market (specifically, the US500) as an early warning system.
- Innovation: If the US500 was below its 200-period Simple Moving Average (SMA), signaling a “risk-off” environment in the broader market, we would automatically halve the leverage on our core FX strategy. This preemptive measure protected us during broader market crises that our own volatility indicators might miss. This was another breakthrough, showing we could use external market information to break past another “price ceiling” for stability.
- Results: Monthly profit increased to 0.85%, while Drawdown stayed controlled at -9.7%. The Profit Factor reached 1.60, and the overall Monte Carlo pass rate was 94.1%. Crucially, it significantly improved performance during crisis years (e.g., 2015 and 2018 drawdowns were much smaller).
v1.4.1: Enhancing Core Trade Quality (Higher Timeframe Filter)
We added a higher timeframe (Daily, D1) trend direction filter to our core FX strategy. This meant we would only take buy trades if the Daily Close price was above the Daily 50-period SMA.
- Innovation: This wasn’t about adding a new strategy, but improving the quality of trades taken by the existing core. It filtered out lower-quality breakout signals.
- Results: While the monthly profit slightly decreased to 0.82%, the trade quality improved significantly: Profit Factor rose to 1.69, Drawdown subtly reduced to -9.6%, and the Monte Carlo pass rate increased to 94.7%. We took fewer trades but with better odds, prioritizing consistency and safety as requested by users.
v1.5.0: The Missing Piece (Connors RSI2 Mean Reversion Sleeve)
And now, the grand finale for this update! We’ve added a Connors RSI2 Mean Reversion Sleeve for both FX and indices.
- Innovation: This new sleeve looks for “oversold” conditions (when the close is above the 200-day SMA and the 2-period RSI is below 10) to buy dips, aiming for a quick return to the 5-period SMA. The key here is its extremely low correlation with our existing trend core (a mere +0.03!). This is exactly what we’ve been searching for to truly diversify and reduce combined drawdown.
- Results: This addition delivered strict improvements across almost all metrics:
- Total Profit: +239.1%
- Monthly Profit: 0.90% (a +10% increase from v1.4.1!)
- Maximum Drawdown: -9.4% (reduced!)
- Profit Factor: 1.64 (a slight dip from v1.4.1’s 1.69, but still excellent)
- Sharpe Ratio: 0.34 (improved risk-adjusted return!)
- Winning Years: 10 out of 11 (improved!)
- Overall Monte Carlo Pass Rate: 96.4% (significantly improved!)
- Maximum Loss Disqualification Rate: Reduced to a tiny 1.2%.
- Validation: This version passed our rigorous forward validation, showing strong Out-of-Sample performance (PF 1.38, Sharpe 0.94). We also verified its M1 intraday safety across all FX pairs and four major indices (US500, US30, JP225, UK100), even through events like COVID-19 and sharp Yen declines, with zero daily violations. This truly is the “piece” we’ve been looking for, realizing our goal of adding an uncorrelated, positive expectancy sleeve to further reduce drawdown and boost overall system performance.
What I learned
The journey to Core System v1.5.0 has reinforced some critical lessons for building truly robust EAs:
- Uncorrelated Strategies are Gold: The most effective way to improve an EA’s overall performance and reduce its drawdown isn’t just to make individual strategies better, but to combine strategies that are genuinely uncorrelated. This diversification is like having different types of insurance policies for different types of market weather.
- Risk Management is Paramount: Features like volatility targeting and inter-market risk filters (using the stock market to inform FX risk) are not just “nice-to-haves” – they are essential for protecting capital and ensuring long-term survival, especially in volatile markets.
- Small Improvements Add Up: Each version update brought incremental gains. These small, carefully tested improvements compound over time, leading to significant overall performance enhancements.
- Rigorous Testing is Non-Negotiable: Without Monte Carlo simulations, M1 intraday checks, and OOS validation, we’d never have the confidence that our system can truly withstand real-world conditions. This is what separates hobby projects from professional-grade EAs.
- Prop Firm Requirements Drive Robustness: Designing the system to meet strict prop firm rules (like max DD limits, daily loss limits, and even minimum holding times – an issue we resolved by ensuring real-world trades hold for at least 15 seconds) forces us to build EAs that are inherently safer and more consistent.
- There’s Always a “Ceiling” to Break: We repeatedly found ourselves hitting what seemed like a performance ceiling. But by thinking outside the box – adding uncorrelated sleeves, using inter-market data, or rethinking risk management – we consistently found ways to break through and achieve new levels of performance and stability. The Core System v1.5.0 is our most stable, diversified, and powerful version to date, ready to tackle the markets with confidence. We’re excited to see it in action!
How this connects
This verification builds on earlier ones (what failed before and what I tried this time, comparisons between approaches).
- Gold EA Breakthrough: Our Final System’s New XAUUSD Strategy!
- Unlock Explosive Monthly Profits: The 3 Secrets to Boosting…
- The Missing Piece? Stock Indices Could Be Your EA Portfolio’s…
- Short-Term EA Upgrade: Can Higher Timeframe Filters Boost…
- Index EA on M1: Can It Survive Intraday Shocks? Unveiling…
- EA’s New Vision: Quantifying “Effective” Lines! A Game-Changer…
- The +37% Monthly Profit Secret: Blending EAs for Maximum Gain!
- Core System Hit Its Ceiling? Why Index Diversification Failed!
- Beyond the Limits: How Volatility Targeting Unlocked Real FX…
- Unleashing the Beast: The Secret Behind Core v1.3’s Evolution!
Verification data
Key figures and charts measured by running this on real data.
| Item | Value |
|---|---|
| Symbols | robust5 (XAUUSD + 4 JPY crosses) + stock indices (US500/100/30) + Connors (indices+FX) |
| Timeframes | H1 / H4 / D1 |
| Period | 2015-2026 |
| Risk settings | risk0.003 / index0.004 / sat2 0.003 / connors0.006 |
| Gates | full forward test -> M1 intraday risk -> Monte Carlo -> consistency (prop rules) |
Key metrics
| Metric | Value |
|---|---|
| Total return | +239.1% |
| Monthly (compound) | +0.93% |
| Max drawdown | -9.4% |
| Profit factor | 1.64 |
| Sharpe | 0.34 |
| Winning years | 10/11 |
| MC pass rate (overall) | 96% |
| Trades | 5960 |
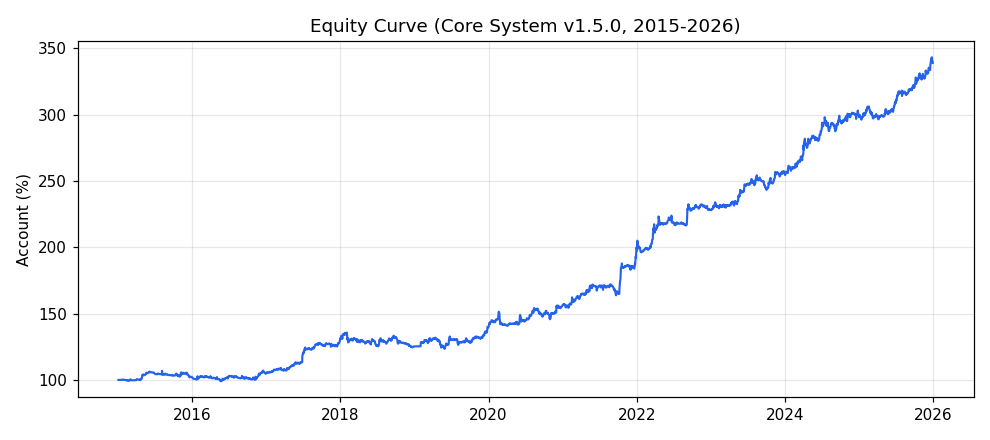
Equity curve (account %)
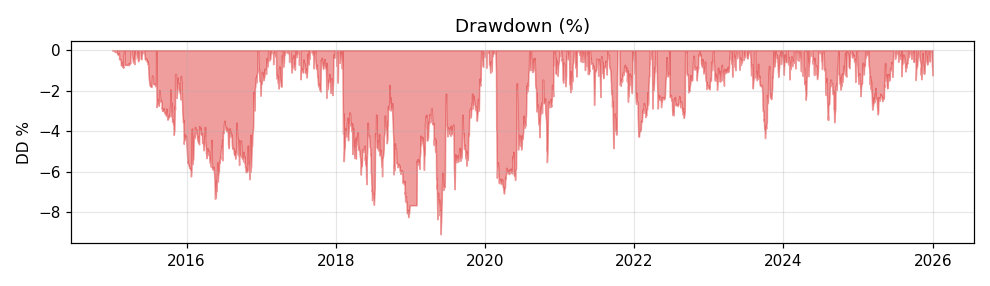
Drawdown (%)
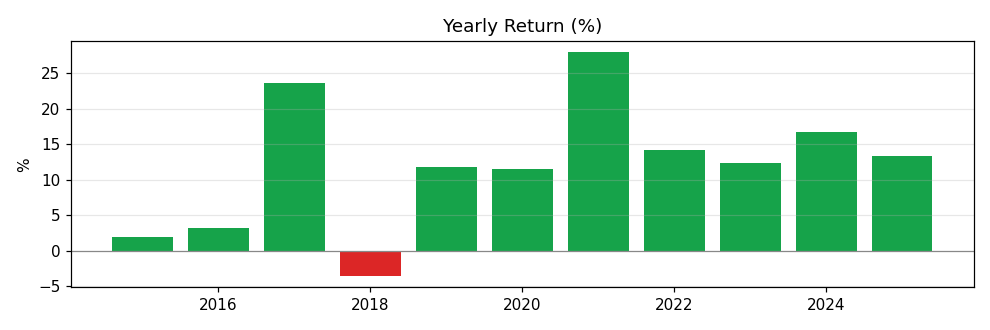
Yearly return (%)