
Making the defense continuous bought 27% more payout at the same risk
From a small idea, replacing an on/off shock guard with a continuous one, through three deployment gates, a full preset recalibration, and converting the freed risk budget into leverage. Eight chained studies, with the reasoning behind every decision.
Turn a defensive switch from on/off into continuously variable. That single change chained through eight studies and ended with the prop account’s steady-state monthly payout rising from 1.92% to 2.43%, a 27% raise. Risk did not increase; crisis-time ruin probability actually fell.
This article records the whole arc (research notes 223, 226 through 230, plus two follow-ups) as one story, including why each decision went the way it did. An EA improvement is never one number; it is a chain of judgments.
First time here? The premise in three minutes
For new readers: this blog is a verification diary. I (one person) build my own automated FX trading program (an EA, Expert Advisor), statistically test every method I can think of, and publish the results, wins and losses alike. “Study N” in the text refers to my numbered research log; this article stands alone.
The stage here is a prop firm account. A prop firm lets you trade company capital once you pass an evaluation (the “challenge”) and pays you a share of profits (80% in my case). For an entry fee around a hundred dollars you get to run an account worth about seventy thousand dollars, with one brutal catch: touch a -5% daily loss or a -10% total loss, even for a second intraday, and you are disqualified on the spot. My EA trades such an account live.
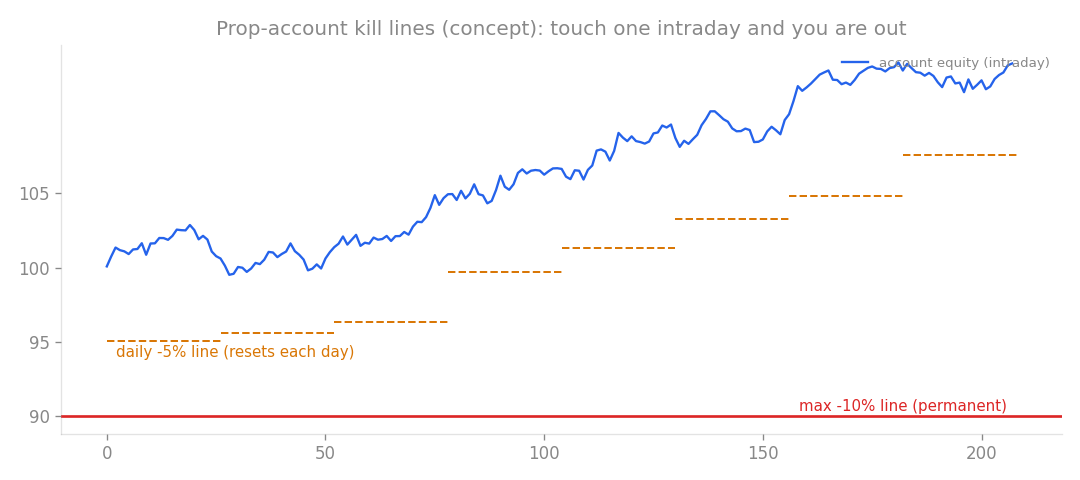
The rules of the arena. The orange daily -5% line redraws every day; the red -10% line is permanent. Every decision in this article revolves around the probability of touching them.
Three terms up front. PF (profit factor) is gross profit divided by gross loss; above 1 means profitable. DD (drawdown) is how far equity falls below its peak, the felt measure of risk. Monte Carlo means reshuffling daily returns into thousands of alternative fates and judging the whole distribution of luck rather than one lucky history.
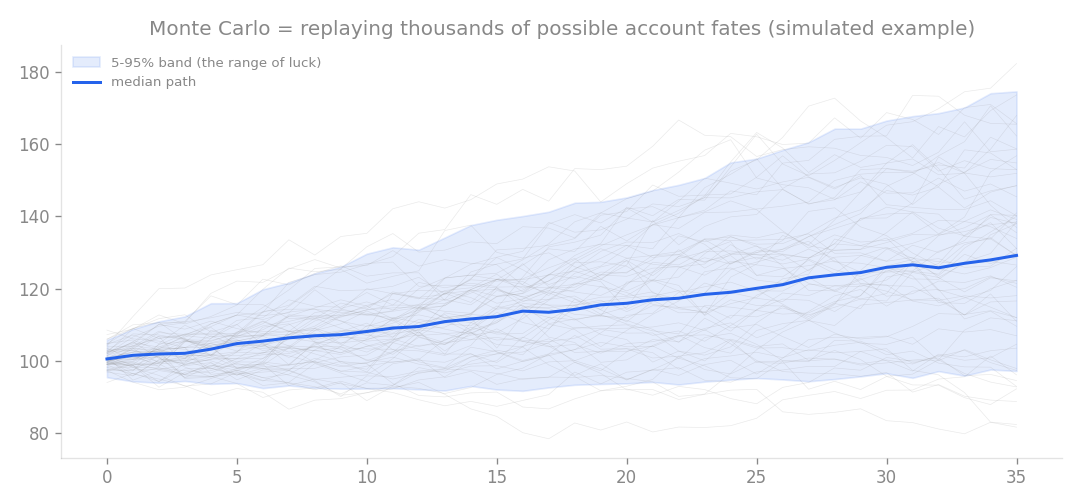
The protagonist of this story is Monte Carlo: every decision below is judged on distributions of possible fates, not on single backtests.
The stage: what the equity-shock guard is
Some scenery first. My EA runs eight sleeves (sub-strategies) in parallel: FX trend following and mean reversion, indices, gold. On top sit two defensive mechanisms, and one of them is today’s protagonist, the equity-shock guard.
The mechanism is simple: when the US stock index’s 5-day return falls past a threshold, new entries shrink to half size. It was born from an autopsy of my worst drawdowns (study 193), which showed that in the opening move of a risk-off event, mean-reversion sleeves love to catch falling knives. A holdout audit that re-tested it on crisis years it had never seen (study 216) showed drawdown improvements in four of six crises and zero harmed ones. Not hindsight curve-fitting; a real defense.
But the original had one crude edge: it was binary. Cross the threshold by a hair, run at 0.5x; miss it by a hair, run at full size. A -2.9% decline sailed through untouched while -3.1% triggered the full cut. That cliff-shaped response never felt right.
Chapter 1: the continuous idea, and the first measurement (study 223)
So I replaced it with a version that interpolates smoothly from 1.0x down to 0.5x with the depth of the decline, holding the deepest intensity through the hold window. Deeper fall, harder squeeze; shallow fall, an early gentle one.
The design choice I care most about: nothing new was optimized. The old binary threshold was reinterpreted as the center of the continuous response, leaving essentially no degrees of freedom to bend toward the data. The most reliable way to avoid overfitting is to never hand the optimizer the knob.
| Metric | Binary (old) | Continuous |
|---|---|---|
| Selection period (2015-23) max DD | -8.6% | -7.9% |
| Unseen period (2023-26) max DD | -3.6% | -3.2% |
| Unseen period monthly return | +1.409% | +1.409% (identical) |
Returns matched to the third decimal; only the drawdown valleys grew shallower, in both periods. Re-levered to the same drawdown, that is worth +4% in-sample and +12% out-of-sample in monthly-return terms.
The same treatment applied to the other defense (the equity filter that shrinks the core when US stocks lose the 200-day line) made drawdowns worse, -8.6% to -10.6%: in shallow pullbacks, the binary version cuts ruthlessly to half while the continuous one leaves too much on. That contrast taught the real lesson. Continuity is not a universal upgrade; it suits mechanisms where danger grows monotonically with depth. Every defense needs its own evaluation.
Chapter 2: three gates before deployment (study 226)
Nothing that merely looks good in a backtest touches the live account. Three gates stand in the way.
Gate one is the intraday M1 audit. Daily backtests only see end-of-day equity, but prop kill lines (-5% daily, -10% total) trigger at any intraday moment. So the account’s minute-by-minute path is rebuilt from 1-minute data. Gate two is a 3-year compounding Monte Carlo: block-bootstrap the daily returns into 12,000 possible three-year lives and inspect the bad tail. Gate three is the neighborhood plateau: nudge the parameters and see whether the conclusion survives. Improvements that live on a knife edge always betray you in production.
| Gate | Binary (old) | Continuous | Verdict |
|---|---|---|---|
| Days touching daily -5% | 0 | 0 | held |
| Worst intraday day | -3.43% | -3.04% | improved |
| MC 95th-pct max DD | 9.2% | 8.8% | improved |
| P(DD > 10%) | 3.0% | 2.4% | improved |
| Same-DD monthly, 5 nearby settings | +1.409% | +1.549 to +1.605% | all better = plateau |
All three gates passed and every risk metric moved the right way. The usual bargain is more return for more risk; this was equal return for less risk, a rare pure upgrade. It shipped to the live EA.
Chapter 3: recalibrating the instruments (studies 227, 228)
Replace a part, re-derive every number that assumed the old part. Tedious, and skipping it is how documentation quietly drifts away from the machine.
The three personal-account presets, re-measured with 12,000 Monte Carlo paths each:
| Preset | Monthly (base / stressed) | Max DD (median / 95th) | P(hit -50%) | P(halving) |
|---|---|---|---|---|
| Low (k2.0) | 2.0% / 1.8% | -11.3% / -18.6% | 0% | ~0% |
| Mid (k3.0) | 2.9% / 2.6% | -16.6% / -26.9% | 0% | ~0% |
| High (k5.0) | 4.8% / 4.2% | -26.5% / -41.5% | 0.1% | 0.9% (was 1.4%) |
PF unchanged at 1.69 everywhere. Versus the old guard: give up 0.04 to 0.10 points of monthly return, gain 0.7 to 1.3 points of 95th-percentile drawdown, and cut the account-halving odds at the high setting from 1.4% to 0.9%. A trade in the right direction, with preset choices unchanged.
Then the full prop campaign, all three stages end to end:
- Median trading days to first payout: 140 to 143 (three days slower)
- First payout size: unchanged
- Steady-state monthly payout: 1.923% to 1.875% (-0.05pt)
- Steady-state ruin under combined stress: 2.6% to 1.7% (-35%)
Here the guard’s true job crystallized: shave a sliver off calm weather, avoid a batch of crisis-time disqualifications. The most expensive event in prop trading is losing the account and restarting from the fee, so the trade is clearly favorable.
Chapter 4: converting the slack into leverage (study 229 and follow-up)
Now the second half. Ruin falling from 2.6% to 1.7% means a 0.9-point margin appeared in the risk budget. Margins can be held as safety or spent as returns.
Re-drawing the equal-risk lines exposed an asymmetry. The personal account (static leverage) barely moves: old k5.0 risk equals new k5.25, worth +0.12pt monthly. The prop steady state moves a lot: cap 2.5 to 3.0 delivers +13% payout while ruin stays below the old setting, a strict dominance on both axes. Crisis-throttling mechanisms compress exactly the tail metrics that gate leverage, so their improvements convert into leverage room at a favorable exchange rate.
The follow-up swept further, enabled by confirming that the simulator’s ruin metric already embeds the 1-minute disqualification probabilities:
| Steady-state cap | Monthly payout | Stressed disqualification |
|---|---|---|
| 2.5 (old) | 1.88% | 1.7% |
| 3.0 | 2.17% | 2.0% |
| 3.5 | 2.43% | 2.3% |
| 4.0 | 2.56% | 2.5% |
The old guard at cap 2.5 ran at 2.6%, so even 4.0 under the new guard is safer than the past. Striking detail: daily -5% breaches were 0.0% at every cap; only the -10% total floor binds. Cap 4.0 was available but hugs that floor closest, so I took the midpoint. Steady-state payout: 1.88% to 2.43%, a 27% promotion.
Chapter 5: the challenge stage answered backwards (study 230)
The same question posed to the challenge stage returned the opposite world.
| Challenge k | Median days to pass | 1-year pass rate | Ever disqualified |
|---|---|---|---|
| 2.5 (current) | 102 | 92.8% | 15.2% |
| 3.0 | 85 | 95.8% | 20.3% |
| 3.5 | 71 | 97.6% | 25.6% |
More risk passes faster AND more often within a year, with no turning point in the swept range. The paradox dissolves once you price failure: a failed challenge costs only the entry fee (about 12,500 yen) and a retry. The game collapses into pass-fast or fail-cheap, and fail-fast dominates in expectation even as the disqualification experience rate climbs from 15% to 26%.
Second surprise: the continuous guard that shines in the steady state slightly SLOWS the challenge (98 to 102 days), because throttling the mean-reversion sleeves delays reaching the +8% target. A defense that saves one stage obstructs another, which is exactly why each stage runs its own preset.
One honest boundary: this optimum belongs to the repeated game. For the single live account running right now, higher k also raises the odds that this particular attempt blows up. Expectation versus variance is a preference, not a calculation, so that call stays with the owner.
What eight studies changed
| Item | Before | After |
|---|---|---|
| Shock guard | binary (0.5/1.0) | continuous (depth-scaled) |
| Worst intraday day | -3.43% | -3.04% |
| Steady-state ruin (stressed) | 2.6% | 2.3% (after the cap raise) |
| Steady-state monthly payout | 1.92% | 2.43% (+27%) |
| Personal preset choices | low 2 / mid 3 / high 5 | unchanged (numbers shifted safer) |
One thing never happened in this whole arc: chasing returns directly. The sequence was make the defense smarter, measure the freed margin, keep the fragile stages safe, and spend the margin only where the account is robust. A risk-management improvement is a currency: hold it as safety or spend it as returns. That is the deepest lesson of the chain.
And through all of it, the underlying system (PF 1.69, +1.06% monthly, configuration D) was never touched. Even when the edge cannot grow, the risk architecture still had this much room in it.