38,439 tests to census the whole market, and only two edges were left
A full-market census in three layers: primitive features, candlestick grammar, and discretionary setups. How tens of thousands of candidates died at the statistics, cost and selection-bias gates, what the last apparent survivors really were, and the homework that protects the one real edge.
“Somewhere in the data, there must be a pattern nobody has noticed yet.” Every trader entertains that thought at some point. I answered it by brute force: three exhaustive layers of candidates built mechanically from price and volume, 38,439 statistical tests in total. The punchline up front: exactly two real edges exist in this data, and I already knew both of them.
This article weaves five studies (research notes 220, 234, 235, 236, 237) into one story. Not just the numbers, but why the design looks the way it does and at which gate each candidate died. With negative results, the process is where the value lives.
First time here? What you need to know
For new readers: this blog is a verification diary. I (one person) build my own automated FX trading program (an EA), statistically test trading methods, and publish everything, wins and losses alike. “Study N” refers to my numbered research log. The tests run on about 11 years of real data across 18 FX pairs, gold, silver and stock indices, from 1-minute to daily bars.
Four terms. PF (profit factor) = gross profit over gross loss, above 1 means profitable. IS/OOS = splitting data into a rule-selection period (In-Sample) and an untouched answer-key period (Out-Of-Sample). FDR correction = the statistical procedure that weeds out lucky hits when you run many tests. bp (basis point) = 0.01%, used for average per-trade returns.
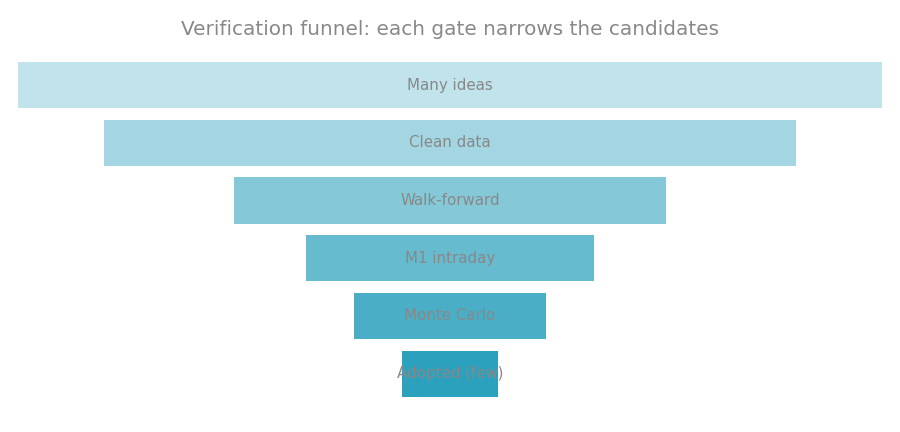
The verification funnel. Thirty-eight thousand entrances, zero new hires.
Why insist on a census
A word on methodology first, because two traps stalk every strategy hunt.
The first is the cherry-picking trap: test only the ideas you happen to think of, and the nagging doubt about “everything untested” never goes away. The second is the multiple-testing trap: test enough things and some will look profitable by pure chance. Flip a thousand coins and someone lands ten heads in a row; do not call that person a master of coin flipping.
A census kills both at once. Define the entire search space up front and test all of it, so nothing is left to wonder about; and since the trial count is known, the luck can be corrected for statistically. I use BH-FDR (a procedure that caps the fraction of false discoveries at 10%), in two stages: survivors of the rule-selection period (in-sample) must survive again on unseen data (out-of-sample).
Prologue: plugging a hole in the map (study 220)
Before the main event, an incident. Auditing an earlier strategy-archetype census (41 methods, 26 symbols, 4 timeframes), I found that TD Sequential, the popular count-to-nine method, had silently crashed on a misspelled class name and never been counted. A census that missed a method is a census with an asterisk.
So 276 combinations (26 symbols, 4 timeframes, 3 variants) got tested under the identical statistical gates:
- FDR survivors: 0 of 265
- Out-of-sample monthly returns: negative for all three variants (-0.056% to -0.241%)
- The best-looking p-value (0.020): a 12-trade micro-sample
- The only variant with enough trades (gold H1): -54% max drawdown, no significance
No treasure in the gap; the map had been right all along. The bug is fixed, future runs include it properly. Auditing whether you really searched everything matters as much as the searching.
Layer 1: 64 primitive states (study 234, 8,781 tests)
Now the main event, starting one level below “strategies”: candle anatomy (12 body/wick dissections), streaks, range and volatility states, position within range, gaps, time anchors, state-times-state interactions, and cross-currency strength factors. Sixty-four primitive states, each tested directly for what the next bar brings, across 26 symbols, four timeframes (M15 for the first time) and two horizons.
| Stage | Remaining |
|---|---|
| All tests | 8,781 |
| Two-stage FDR | 636 |
| Above cost | 73 |
| Precision tests and controls | a handful |
| Selection-bias correction (DSR) | 0 |
A happy discovery along the way: 34 of the 73 cost-clearing candidates were independent rediscoveries of the weekend-gap sleeve already running in my live account. A from-zero scan digging up the edge I actually trade is the best possible validation of the machinery itself.
The other 39 sank in precision testing. Most were index-long beta: in a bull market, any dip-buying rule looks smart until you compare it against 200 sets of random-timing entries in the same stocks. One monster, a CHFJPY gap pattern at PF 4.55, lived entirely in thin rollover hours where the assumed execution is fiction.
The last holdouts were short-timeframe mean-reversion setups on minor crosses (mean reversion means buying an oversold dip and selling the bounce), like GBPNZD M15 at PF 1.38 and +2.53% monthly (with a -59% drawdown at naive 1% risk). Enter the final gate: DSR, the Deflated Sharpe Ratio, which discounts for the 8,781 attempts. Every candidate scored below 0.5. Try that many things, and hits this size arrive by luck alone.
Layer 2: candlestick grammar (study 235, 24,666 tests)
Next, the pattern layer. Each bar becomes one of eight symbols (direction, range width, close position), and every sequence of length two (64) and length three (512) goes on trial across all symbols and timeframes. A comprehensive statistical hearing for traditional candlestick lore.
Of 24,666 tests, 154 cleared the two-stage FDR and six cleared costs. The final examination of those six:
- Three silver fade patterns: census margins of 1.2 to 2.5 times cost, yet the realistic event-driven engine flipped them to PF 0.86, an outright loss. Real silver spreads are heavier than the census assumed, and the paper margin evaporated
- Three minor-cross weakness-buys: two judged beta by the random-timing control; the last (a GBPNZD 3-bar sequence) clung to p=0.005 on originality but scored DSR 0.005 against the cumulative 33,447 trials. Luck’s territory
Two independent scans, features and patterns, had now converged on the same two places: weekend gaps and boundary-liquidity reversion. If candlestick patterns hid a secret, it had 33,000 chances to show its face.
Layer 3: the discretionary playbook (study 236, 4,992 tests)
Finally, the structural language of discretionary trading: bullish reversal candles at support, pullbacks within trending Dow structure, perfect-order momentum bars, squeeze breakouts. Fifteen named candles, chart-pattern completion events, pivot proximity, eight composite textbook setups, all mechanized.
Fifteen setups passed the in-sample gate. All fifteen evaporated on unseen data, the cleanest wipeout of the three layers.
The in-sample survivors were ironic on inspection. The largest group, the H1 shooting star (a bearish reversal candle) across eight symbols, carried the wrong sign: price rose +1.0 to 2.4bp after it. And the flagship, support-plus-bullish-reversal, averaged -0.56bp even in the selection period. The royal setup of discretionary trading was not merely useless as a filter; it pointed the wrong way.
The anticlimactic unmasking of the survivors (study 237)
The minor-cross short-timeframe reversion kept resurfacing through all three layers. I drew up a multi-year monitoring plan (maybe more data would push its DSR over the bar) and moved to sleeve design. That is when the mask came off.
Adding the standard safety filter that avoids trading around server midnight erased the edge instantly (GBPNZD PF 1.20 to 0.99, CHFJPY 1.16 to 0.88). An hourly decomposition settled the cause:
| Hour | Conditional return |
|---|---|
| Server midnight hour | +12bp |
| The 23:00 hour | +7bp |
| Every other hour | +1.0 to 1.3bp (below the 1.5bp round trip) |
Measured spreads in that midnight hour run 6 to 70 times daytime. The “bounce” the statistics kept finding was the bid quote (the data’s pricing basis) sinking mechanically during rollover and recovering: paper profit in exactly the place where static spread assumptions lie hardest. A second route through finer level detection (1,040 tests) produced five survivors, all crowded into the same 23:00-00:00 window. Same ghost. The monitoring plan died with its subject.
This midnight mirage later reappeared twice in other studies, and excluding those hours at scan time is now standard procedure here. Understand a trap once and you can refuse it at the door forever after.
Settling the account: what 38,439 tests bought
| Layer | Tests | Final survivors |
|---|---|---|
| Census gap (TD Sequential) | 276 | 0 |
| Features | 8,781 | 0 (besides 34 weekend-gap rediscoveries) |
| Pattern grammar | 24,666 | 0 |
| Structure and discretion | 4,992 | 0 |
Reality contains two things: the deployed weekend-gap fade (large enough to clear the cost wall, the family’s sole survivor) and a boundary-liquidity reversion that exists but cannot pay its costs or survive selection-bias discounting. Nothing else caught in this mesh.
An important boundary on the claim: this is not proof that no edge exists anywhere. It is certainty that none exists in this search space (the language of price and shape) at these costs (retail spreads). Indeed, soon after this census, a different market (single stocks) and a different methodology (pre-registered hypotheses) did produce a genuine survivor.
The homework: guard the real one with the ghost-hunting gear
One practical debt remains. The deployed weekend-gap sleeve also enters near Monday midnight, kin to the ghost family. Measured Monday-midnight median spreads: 23.6 pips on GBPJPY (21 times daytime), 73.5 pips on CHFJPY (57 times). The edge size (15-plus pips) should clear that by an order of magnitude, but the moment four weeks of live spread telemetry accumulate, a mandatory reconciliation runs.
Perhaps the census’s greatest yield was never a discovery at all, but a field guide to mirages, and a checklist that protects the one real thing.
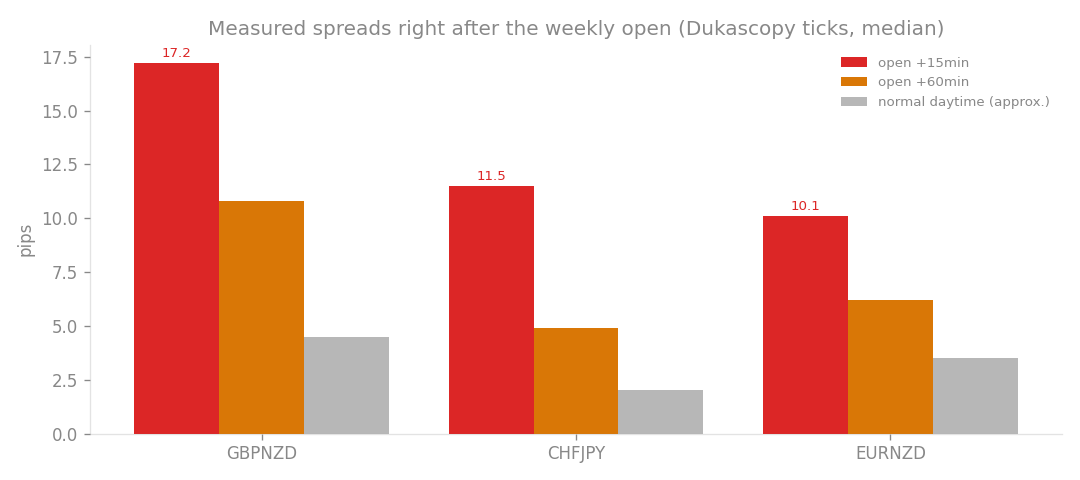
The measured basis of that homework: right after the weekly open, trading costs balloon to several times their normal size. The ‘bounce’ born in those minutes was our mirage.