
Chasing 3% a month means a 70% drawdown, and every smart allocation lost to fixed weights
How to blend multiple trading systems and how far risk can be pushed: pricing the 3% monthly target, finding the best mix of three systems, watching five dynamic allocation schemes lose to fixed weights, and redrawing the return-versus-risk exchange rate after real improvements.
I once asked my own data a simple question: what would a 3% monthly return actually cost? The answer came back as a 70% drawdown, which is another way of saying “your account, eventually”. And a second finding from the same line of work: five clever schemes for shifting money between strategies all lost to plain fixed weights.
This article merges four studies (research notes 70, 81, 95 and 127) into one story about the two questions every multi-system trader faces. How should the systems be mixed, and how far can the risk dial be turned? No exotic new strategy appears here. This is about the exchange rate between return and risk, which turned out to be the backbone of the whole operation.
First time here? What you need to know
For new readers: this blog is a verification diary. I (one person) build my own automated FX trading program (an EA), statistically test trading methods, and publish everything, wins and losses alike. “Study N” refers to my numbered research log. The tests run on about 11 years of real data across FX pairs, gold, silver and stock indices.
Four terms. PF (profit factor) = gross profit divided by gross loss, above 1 means profitable. DD (drawdown) = the peak-to-trough decline in account value. MC pass rate = the probability of passing prop-firm loss rules, estimated by resampling daily returns (a prop firm funds traders who pass its test, and disqualifies them at fixed loss limits). And the star of this article, the Calmar ratio = return divided by maximum drawdown, a measure of how efficiently a system converts risk into profit.
Pricing the 3% dream (study 70)
The starting point was a hard target: 3% per month, no less. I bundled the core strategy with six stock indices and a Connors model (a method that buys short-term oversold snapbacks), then turned up the aggressiveness step by step, measuring monthly return against drawdown at each point.
| Monthly return | Max drawdown |
|---|---|
| 0.6% | 10% |
| 1.1% | 24% |
| 2.0% | 49% |
| 2.65% | 69% |
Return and drawdown moved in near-perfect proportion. The Calmar ratio plateaued between 1.0 and 1.3 no matter what I did: allocation optimization, more indices, the Connors layer, nothing lifted it. Keep drawdown inside 10% and the ceiling is about 0.6% per month. Push to 3% and the drawdown reaches roughly 70%.
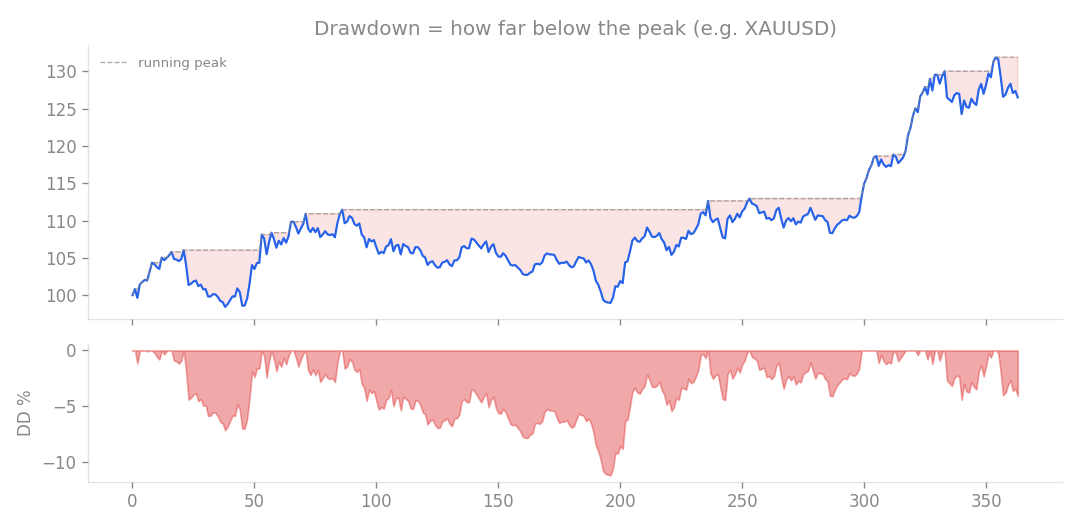
Drawdown in one picture. Every extra bit of monthly return deepens this valley proportionally.
Why is 3% out of reach? Earning 36% a year inside a 10% drawdown requires a Calmar of 3.6, a level even elite funds struggle to sustain. The measured trend edges available in price and index data top out at 1.0 to 1.3. So a 3% monthly target is not an income plan. It is a bet that almost certainly ends in a blown account.
That left three honest options: reset the target to an achievable 0.6% or so and grow income through account size and account count, look for better Calmar in different markets, or knowingly treat the whole thing as a lottery ticket. What I refused to do was build a system with invented numbers.
Choosing the right mixing partner: 0.60% to 0.82% (study 81)
Next question: what happens when verified systems are blended? I combined three of them at the daily-return level. The core, a satellite built from Bollinger Band mean-reversion, and satellite2, a mechanized version of discretionary Dow structure with horizontal levels. Correlations were 0.43 between core and satellite, 0.47 between core and satellite2, and 0.19 between the two satellites.
| Mix (scaled to 10% DD) | Monthly return | Sharpe | MC pass rate |
|---|---|---|---|
| Core alone | 0.60% | 1.17 | 91% |
| Core + satellite2 | 0.82% | 1.25 | 92% |
| Sharpe-weighted | 0.72% | - | - |
| Equal thirds | 0.58% | - | - |
Core plus satellite2 won on both Sharpe (return per unit of risk) and MC pass rate. The original satellite, with its low 0.38 Sharpe, actively dragged the equal mix down to 0.58%. Diversification is not “mix everything”. Excluding the component that hurts is as much a part of allocation as adding the one that helps.
I then verified the theory in a precise single-account simulation where all systems trade together. Core alone: 0.58% monthly, 10.0% DD, 91% MC pass rate, profitable in 9 of 11 years. Core plus satellite2 at 0.003 risk each: 0.78% monthly, PF 1.45, 11.7% DD, 91% MC pass rate, profitable in 10 of 11 years. Because of the correlation, drawdown ran hotter than the approximation promised, so squeezing back inside 10% meant cutting risk to about 0.85 times, and the realistic gain settled at roughly +15% over core alone.
The headline +37% from the quick approximation was optimistic. The measured truth was +15%, plus one extra winning year. Still a real, bankable improvement inside a safe drawdown.
Five smart allocation schemes, five losses (study 95)
Once the mix is set, greed asks the obvious follow-up: would shifting the weights with market conditions earn more? Across 13 strategies (four core plus nine pair-specific), I compared fixed equal weighting against five dynamic schemes, all computed with no hindsight: inverse volatility (more weight to the calm ones), risk parity (equalize each strategy’s risk contribution), minimum variance, momentum (more weight to recent winners), and mean-variance (the statistically optimal mix).
| Allocation method | Calmar |
|---|---|
| Fixed (equal) | 1.43 |
| Inverse volatility | 1.03 |
| Momentum | 0.53 |
| Mean-variance | 0.13 |
A clean sweep for doing nothing. The most mathematically sophisticated method, mean-variance, finished dead last at 0.13.
Two causes stand out. First, the strategy set was already well balanced, so any tilt just added timing lag and estimation error, a game of rock-paper-scissors played one move late. Second, complexity is fragile. Mean-variance depends on estimating covariances, and small noise in those estimates wrecks the weights entirely.
So should the weights ever move? For these five schemes, at least, the data says no. Set them, leave them alone, and let simplicity be the edge.
Redrawing the exchange rate after real upgrades (study 127)
The final study re-measured the return-versus-drawdown frontier on v1.5.0, the system as it stood after stacking genuine improvements on the study-70 baseline: vol-target (lot sizing scaled to recent realized volatility), a stock-index signal, higher-timeframe logic and the Connors layer. I scaled the whole system’s risk by a multiplier and measured each point, including the M1 worst day (the largest single-day loss found by rebuilding intraday equity from 1-minute bars).
| Multiplier | Monthly return | Max DD | MC pass rate | M1 worst |
|---|---|---|---|---|
| x1.0 | +0.93% | -9.4% | 96% | 2.42% |
| x1.6 | +1.27% | -13.3% | 91% | 3.73% |
| x2.0 | +1.46% | -15.4% | 84% | 4.56% |
| x2.4 | +1.64% | -17.6% | - | - |
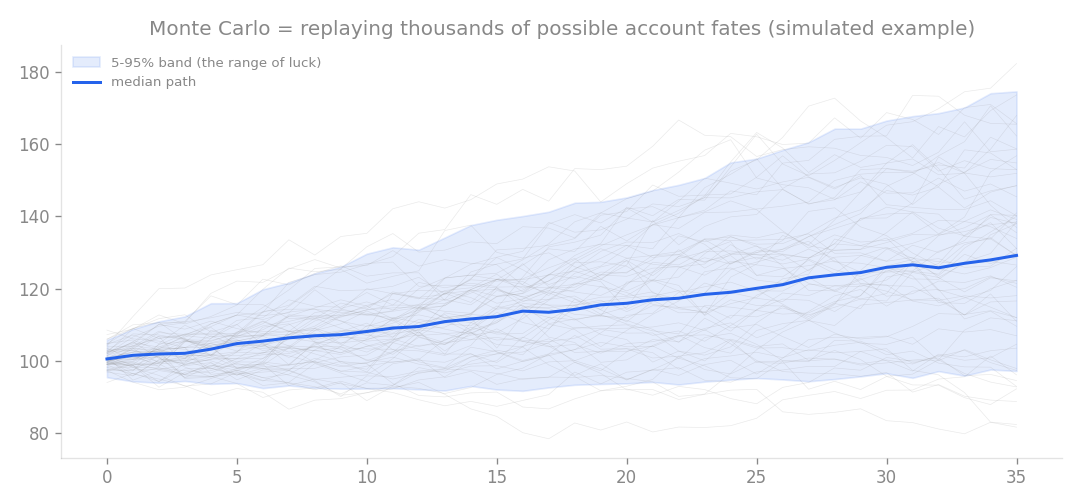
How the MC pass rate in the table is measured. Turning up the multiplier steadily raises the share of futures that end in disqualification.
Two things matter here. First, the safe-zone return moved: at a 10% drawdown, monthly return rose from 0.6% to 0.93%, an improvement of roughly 50 to 65%. Stacked edges raised the payout for the same risk. Second, the ceiling did not move: Calmar still capped out at 1.0 to 1.1, meaning a 2% monthly return would still require a 22 to 24% drawdown. Leverage changed my position on the line and changed the line’s slope not at all.
Applying real-cost adjustments (an 88 to 95% transfer rate and 1.5 to 2% of extra drawdown), the realistic landing spots became about 0.8% per month at a 96% MC pass rate for the conservative setting, and about 1.3% per month at 84% for the aggressive one.
What the four studies agree on
Line the studies up and one picture emerges.
- Return and drawdown trade at a nearly linear rate, and the slope (Calmar) is the system’s true skill. Leverage only slides you along the line
- The right way to mix is boring: add the partner that helps, drop the component that hurts, and freeze the weights. All five dynamic schemes were pure cost
- The only way to raise the line itself is to stack real edges, which is exactly what moved the 10%-drawdown return from 0.6% to 0.93%
The journey started with a 3% dream and landed on a modest number: a bit under 1% per month, in the safe zone, on fixed weights. But unlike the 70%-drawdown gamble, that modest number rests on 11 years of real data and explicit failure-probability math. The backbone of a trading operation is not cleverness. It is knowing the exchange rate.
This article consolidates studies 70, 81, 95 and 127.